Quiz 4
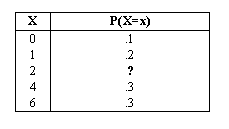
1. Using the table, find the expected value.

a. 3.3
b. 3.5
c. 3.6
d. 3.4
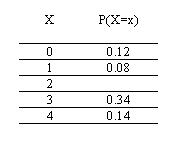
2. The table shows the probability distribution function for the number of high school years that students at a local high school study a single foreign language. Over the long run, the average number of years that we would expect students at this high school to study a single foreign language is:

a. 2.5
b. 3
c. 2
d. 2.3
3. Using the table, find the probability that X is greater than 1.

a. 0.1
b. 0.7
c. 0.3
d. 0.6
4. Approximately 70% of U.S. adults had at least one pet as a child. We randomly survey 60 U. S. adults. We are interested in the number that had at least one pet as a child. Does X follow a Binomial Distribution?
a. No, because not all children can have pets.
b. No, because 30% did not have pets.
c. Yes, because each adult has a 70% chance.
d. Yes, because most children like pets.
5. The table shows the probability distribution function for the number of high school years that students at a local high school study a single foreign language. If 10 graduating students from this high school were randomly selected, would it be unusual for all 10 of them to have studied exactly 3 years of a foreign language?

a. No, because each person is independent of the other.
b. Yes, because the probability for a student is 0.34, which is less than one-half.
c. No, because 3 is the mode.
d. Yes, because the probability is close to zero.
6. If sampling without replacement occurs, do the picks follow the Binomial Distribution?
a. Yes, if we are counting the number of successes.
b. No, because the probability of success on each pick changes.
c. Yes, because each pick is independent from the others.
d. No, because we may not have any successes.
7. The table shows the probability distribution function for the number of high school years that students at a local high school study a single foreign language. What is the probability that X=2?

a. 0.42
b. 0.32
c. unable to determine
d. 0.20
8. Approximately 70% of U.S. adults had at least one pet as a child. We randomly survey 60 U. S. adults. We are interested in the number that had at least one pet as a child. The probability that at least 3 adults had at least one pet as a child means:
a. P(X=0)+P(X=1)+P(X=2)+P(X=3)
b. P(X=0)+P(X=1)+P(X=2)
c. P(X=4)+P(X=5)+P(X=6)+ ...
d. P(X=3)+P(X=4)+P(X=5)+ ...
9. Ninety-four percent of California community college transfers feel that their community college adequately prepared them to handle upper-division coursework at their transfer university. We randomly survey 14 California community college transfers. We are interested in the number that feel that their community college adequately prepared them to handle upper division coursework at their transfer university. List the values that X, the Random Variable, may take on.
a. 0, 1, 2, ..., 94
b. 1, 2, 3, ..., 14
c. 0, 1, 2, ..., 14
d. 1, 2, 3, ..., 94
10. Ninety-four percent of California community college transfers feel that their community college adequately prepared them to handle upper-division coursework at their transfer university. We randomly survey 14 California community college transfers. We are interested in the number that feel that their community college adequately prepared them to handle upper division coursework at their transfer university. Find the probability that more than half felt that they were prepared.
a. 0.00
b. 1.00
c. 0.53
d. 6.59
|