Exam 3: Lessons 5, 6, 7
Name_______________________
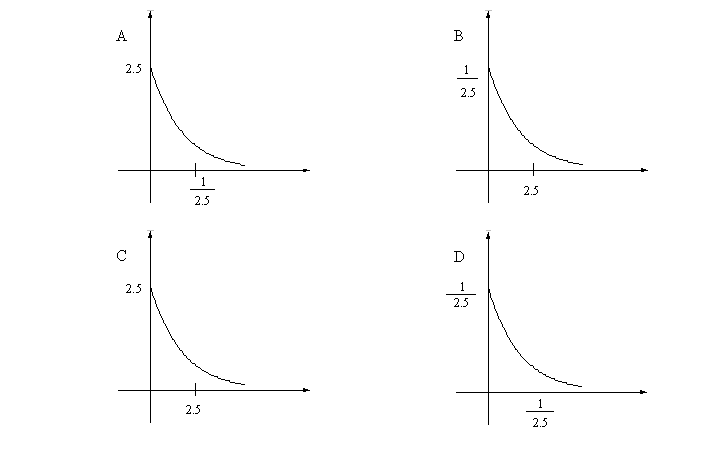
Questions 1 – 3 refer to the following:
Assume the amount of money seventh–grade students spend on food each day at school is exponentially distributed with an average of $ 2. 50 .
1. Which graph best describes the distribution:
2. Find the probability that a randomly selected seventh–grade student spends less than $ 4 a day on food.
A. 0. 7981 B. 0. 2019 C. 0. 9999 D. 0. 0001
3. 85 % of the seventh–grade students spend more than what amount per day ?
A. $ 2. 12 B. $ 0. 75 C. $ 4. 74 D. $ 0. 41
For Questions 4 – 5:
The amount of time that intermediate algebra students at Leland High School spend doing their homework per day is normally distributed with a mean 1. 5 hours and standard deviation 0. 75 hours.
4. If one student is randomly chosen, what is the probability that the student does intermediate algebra homework at least 2 hours per day?
A. 0. 7475 B. 0. 4259 C. 0. 2525 D. 0. 6784
5. 60 % of these students spend at most how many hours doing their homework?
A. 1. 69 hours B. 1. 31 hours C. 1. 5 hours D. 0. 2533 hours
For Questions 6 – 7:
Llamas are excellent pack animals. It is known that the weight of supplies carried by llamas follows a normal distribution with a mean of 62. 5 pounds and a standard deviation of 6 pounds.
6. Find the probability that the weight of supplies carried by one randomly chosen llama is between 60 and 70 pounds?
A. 0. 4441 B. 0. 5559 C. 0. 8944 D. 1
7. The middle 50 % of weights of supplies carried by a randomly chosen llama is between _____ and _____.
| A. 0 and 62. 5 pounds |
B. 58. 45 and 66. 55 pounds |
| C. 56. 5 and 68. 5 pounds |
D. There is not enough information given. |
8. Which of the following are true for the normal distribution?
| I |
More values fall close to the mean than fall far away from the mean. |
| II |
The mean and standard deviation cannot be the same. |
| III |
A change in µ causes the graph to shift to the left or right and changes the shape of the graph. |
| IV |
A change in s causes a change in the shape of the normal curve. |
A. I , IV B. I , II , III , IV C. I , II , III D. III , IV
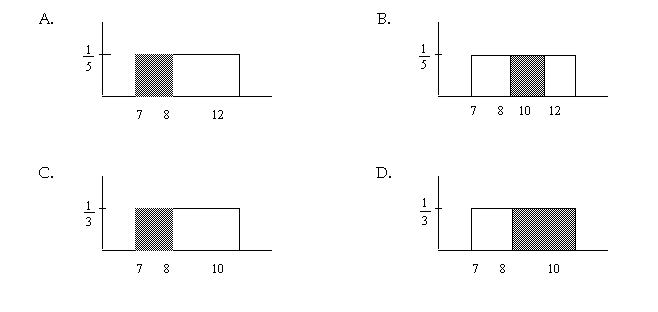
Questions 9 – 13 refer to the following:
The length of time junior high school students sleep per night follows an approximate uniform distribution from seven to eleven hours. Suppose we randomly select a junior high student.
9. Find the probability that the randomly selected student sleeps less than 8 1/2 hours per night.
A. . 2143 B. 0. 7727 C. 0. 4705 D. 0. 375
10. Find the probability that the randomly selected student sleeps eight to twelve hours per night.
A. 0 B. 1. 0 C. 0. 7500 D. 0. 25
11. On average, how long does a junior high school student sleep per night ?
A. 4 hours B. 9 hours C. 8 hours D. 11 hours
12. 65 % of junior high school students sleep at least how many hours ?
A. 9. 6 hours B. 6. 5 hours C. 7. 8 hours D. 8. 4 hours
13. We are interested in the probability that a randomly selected student sleeps less than eight hours, knowing that he/she sleeps less than ten. Which graph best depicts this situation?
|