I. MEASURING RESISTANCE
Purpose: In this lab you
will learn to construct a circuit and measure voltage, current, and
resistance using a VOM and a DMM. When using meters to measure values,
you want to learn to use the meter with confidence. You will study the
relation called Ohms' Law and you will draw a graph and interpret it.
Equipment List:
Simpson VOM
hand-held DMM
HP-DMM
DC power supply (for part 2 only)
Five carbon-type resistors:
from about 50 to 100,000 ohms
Assorted banana cables
Introduction: Typical
carbon type resistors have a color code on their body that you must
learn to interpret. Learn how to read the resistor's value and its
"tolerance" from the code below.
0 Black
Tolerance (i.e. nominal uncertainty)
1 Brown
Nothing ± 20% (+ or -
nominal value)
2 Red
Silver
± 10%
3 Orange
Gold ± 5%
4
Yellow
Red ± 2%
5 Green
6 Blue
7 Violet
8 Grey
9 White
Hold the resistor so the bands of color are located on the left side of
the resistor; the first and second colors give the two significant
figures of the resistor's value (no decimal point between them). The
third color from the left gives the power of ten. The fourth color (if
it exists) is the tolerance value.
Procedure:
1. Determining resistance by direct measurement: There are no voltages from power supplies
and no currents to be measured in this part. Measure
the resistance of all five resistors with the VOM, hand-held DMM, and
HP DMM (use 2 wire mode). Perform a discrepancy test against each
measurement compared to the nominal value stamped with the color code
on the resistor. State whether the measured value lies within the most
probable range determined from the tolerance stamped on the resistor.
Comment on the accuracy of the three measuring instruments used. What
range setting on your instrument gives the most precise reading?
Just for curiosity, measure your own resistance,
from one hand to the other; examine how your resistance can change as
you change the tightness of your grip or as your hands become moist.
Record the values and variations of your body's resistance in your lab
book.
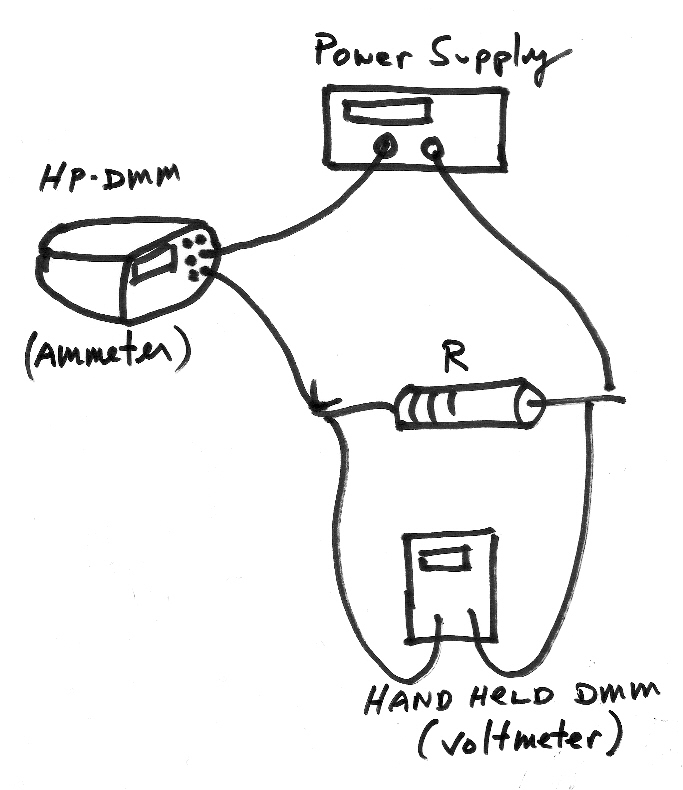
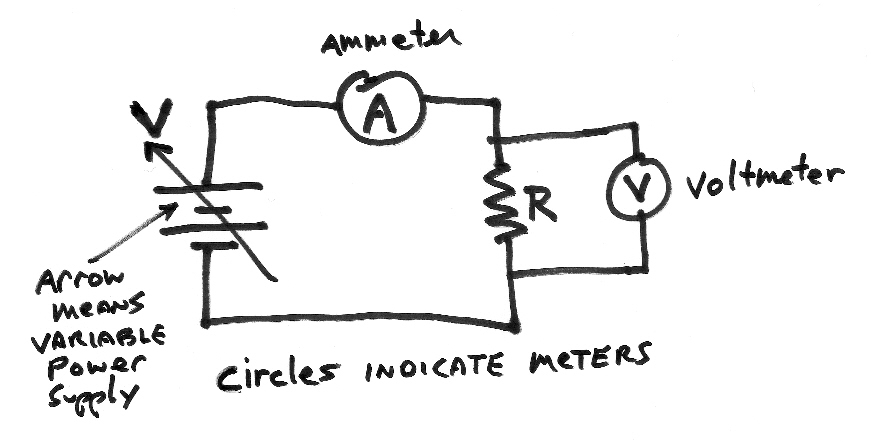
2. Determining resistance by calculating a slope from measured
data: Take one of your resistors and construct a circuit based on
the schematic and pictorial diagram below. Construct the circuit first
and then connect your meters. Use the HP DMM for the current readings
and the hand-held DMM for the voltage. Prepare your
lab book so that you can record your data and draw your graph at the
same time, point by point.
Take your data by starting at a low voltage value (e.g. less than five
volts) and record the voltage across the resistor and the current
through the resistor. Increasing the voltage each time, repeat your
measurements four more times for a total of five different pairs of
voltage and current readings. Each successive data point will represent
an increase in voltage and current readings. Plot voltage on the
horizontal and current on the vertical axis; this graph is called a
"characteristic curve" of the resistor.
Draw an "eyeballed" straight line using your ruler that best represents
the line formed by the data points.
Don't use the origin as a data point. Don't connect one point to the
next point, draw one straight line. Don't "force" the line to intersect
as many points as possible; the best fit line may not intersect any
data points.
Analysis:
Use the data points to determine the line, then use the line, not the
data points, to determine the slope. Choose two points on your drawn
line (not data points and outside the range of the data points) that
span a large part of your graph. Calculate the resistor's value by
applying Ohms' law and understanding how the slope of the graph is
related to the resistance.
Also, have a computer graph the data and calculate a least squares best
slope
value to yield a more accurate value for the resistor. Compare the
mathematical best slope from the computer (using linear regression) to
your eyeball best slope from the hand drawn graph in your lab book.
Compare your resistor's value from the computer graph to the resistor's
value from the three measurements of the same resistor as performed in
part
1. Neatly tape the computer graph in your lab book.
Conclusion:
Discuss the agreement of all your resistor's values with one
another.