II. OHMIC AND NON-OHMIC RESISTANCES
Equipment List:
hand-held DMM
HP-DMM
DC power supply
Resistor and light bulb circuit board
Assorted red and black bananas and alligator clips
WARNING: THROUGHOUT THIS LAB, YOU SHOULD NEVER DIRECTLY
MEASURE THE RESISTANCE OF A RESISTOR WHEN THERE IS A CURRENT ALREADY
THROUGH IT FROM
A POWER SUPPLY. DOING SO MAY DAMAGE A METER. FOR THE SAFEST APPROACH,
ONLY
MEASURE RESISTANCE DIRECTLY USING AN OHMMETER WHEN THE
RESISTOR IS REMOVED FROM A CIRCUIT.
Goal and Procedure:
1. Determine the resistance of the "power resistor" found on the
circuit board provided by calculating a slope from measured data and
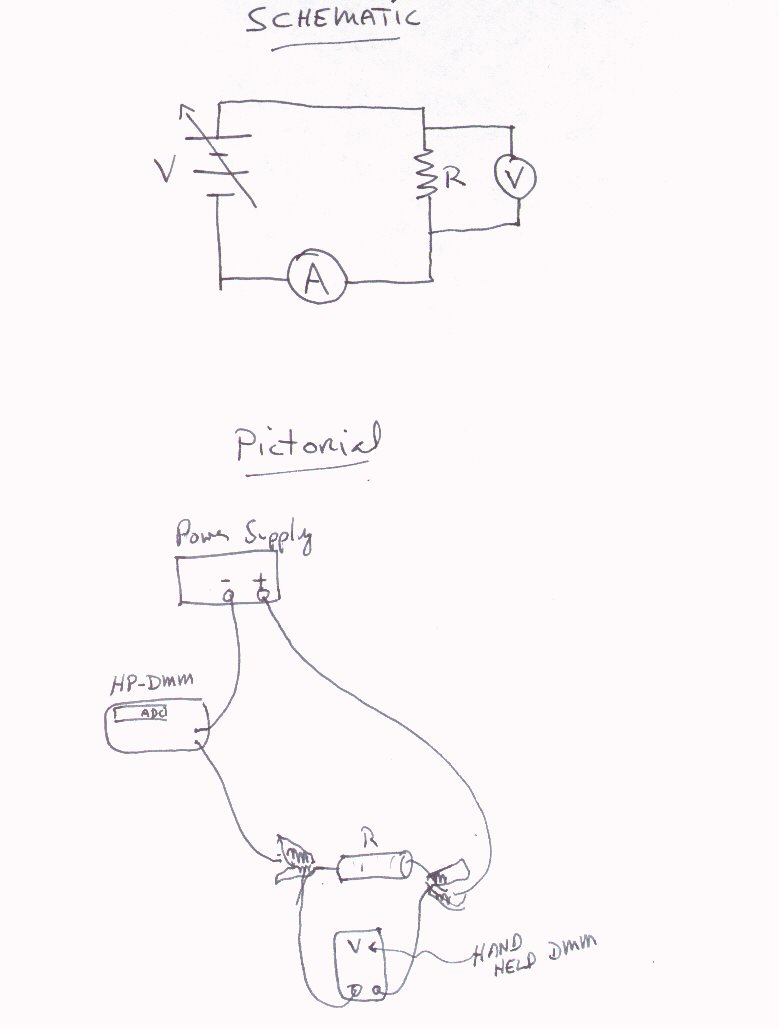
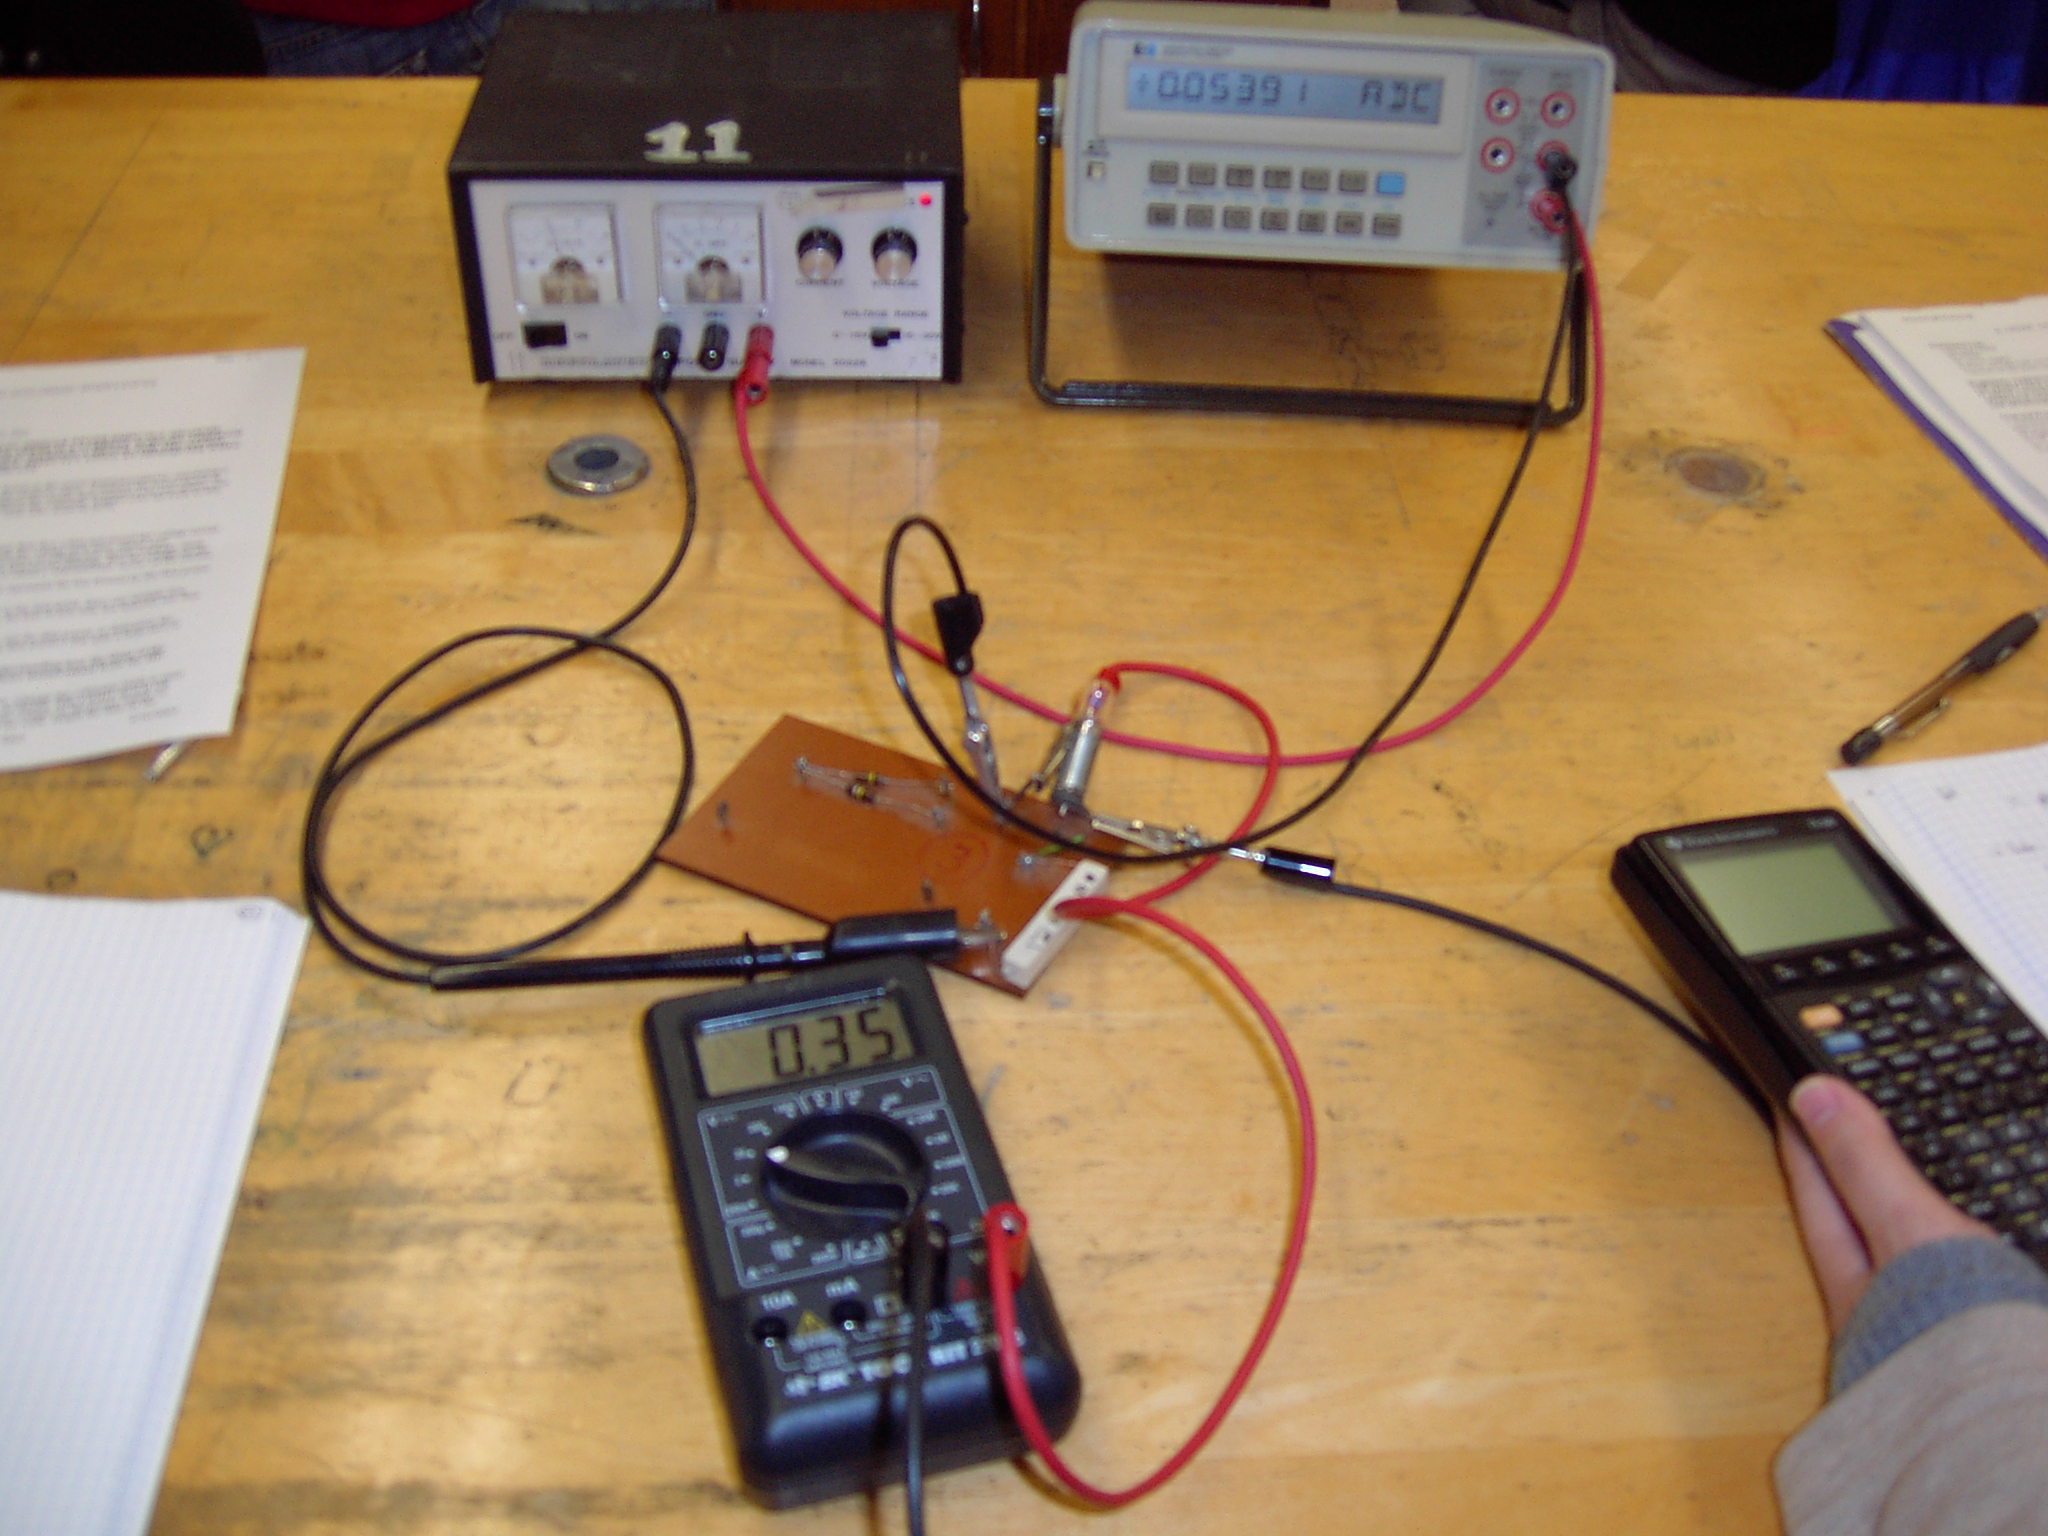
relating the slope to the resistor's value: Construct the circuit
shown in the diagram below or in your lab's lecture. First construct
the circuit, then connect your two meters. Use the HP-DMM as the
ammeter and the hand-held DMM as
the voltmeter. Prepare your lab book so that you can record your data
and
draw your graph at the same time, point by point.
Your graph should be a full page graph.
Take your data by starting at a low voltage value (e.g. less than
five volts) and record the voltage across the resistor and the current
through the resistor. Increasing the voltage each time, repeat your
measurements four more times for a total of five different pairs of
voltage and current readings. Each successive data point will represent
an increase in voltage and current readings. Plot the voltage on the
horizontal and the current on
the vertical axis; this graph is called a "characteristic curve" of the
resistor.
Draw an "eyeballed" straight line using your ruler that best
represents the line formed by the data points.
Graphing tips:
Don't use the origin as a data point. Don't connect one point to the
next point, draw one straight line. Don't "force" the line to
intersect as many points as possible; the best fit line may not
intersect any data points.
Use the data points to determine the line, and you use the line, not
the data points, to determine the slope. For the slope, choose two
points on
your drawn line (not data points!) that span a large part of your
graph,
ideally outside all your data points.
Calculate the resistor's value by applying Ohms' law and
understanding how the slope of the graph is related to the resistance.
Compare your value to a direct measurement from the HP-DMM
2. Now incorporate the light bulb "in series" with the power
resistor. Change the voltmeter leads to read the voltage across the
light bulb. DO NOT EXCEED SIX VOLTS ACROSS THE LIGHT BULB OR THE BULB
WILL BURN OUT! Take twenty data points varying the voltage on the power
supply so that the voltage across the bulb goes from less than a
volt to almost six volts. Graph the data on the computers.
Calculate the resistance of the bulb at
a small current and then at a relatively large current. Is it correct
to
use the tangent line to the curve to determine the resistance of the
bulb?
Think about it because the answer is NO (then how do you determine the
resistance of the bulb from the graph?). For curve fitting on the
graph, you might try a "power" fit.
More: In the previous lab, you measured your skin resistance between
two points. Knowing that value, use Ohm's law to calculate the current
through you if nine volts were applied across the same two points.