|

Lesson 6.1 Description of the Normal Probability
Distribution
Characteristics of the Normal
- The curve of the normal is continuous, bell-shaped, and symmetric.
. X X
- The mean, median, and mode are the same.
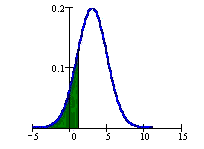
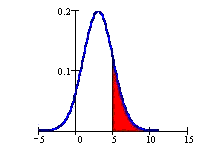
- The total area under the curve is 1. Probability = are a under the curve either to the left of x, the right of x, or between two values of x.
- Changing the mean, μ, moves the curve along the x-axis, but the shape stays the same.
- Changing the standard deviation, σ, causes the bell-shape to become wider (larger standard deviation) or narrower (smaller standard deviation).
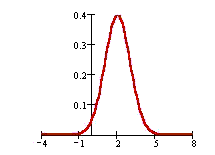
- Most of the values are close to the mean or equal to the mean. In the graph above, the mean is equal to 2. Most values are close to 2 or equal to 2.
- 68% of the values fall within one standard deviation of the mean. In the graph above, the standard deviation is 1. Since the mean is 2, 68% of the values fall between 1 and 3 (on the x-axis).
The normal distribution applies to most disciplines including economics, psychology, business, the sciences, nursing, and mathematics. It is the most widely used and abused of all the probability distributions.
Notation and Formulae
The parameters of the normal are the mean, μ, and the standard deviation, σ.
Notation: If X is the random variable for the normal probability distribution, then X ~ N(μ, σ).
The area to the left of x is represented by P(X < x) and is called the cumulative distribution function.

Area to the right is P(X > x) = 1 - P(X < x).

Please continue to the next section of this lesson.
Up » 6.1 Normal Probability Description » 6.2 Standard Normal Probability » 6.3 Normal Probability
|