|

Lesson 8.4 Confidence Interval for a Single
Population Proportion
Notation and Formulae
Remember that the confidence Interval format is:
(point estimate- EB, point
estimate + EB)
where EB is the margin of error or error bound.
In a CI for a single population proportion where
the population standard deviation is known, the
point estimate is the estimated proportion p' and
the error bound is the error bound for the
proportion EBP. So, the CI has the format:
(p' - EBP, p' + EBP)
Even though we use technology to calculate the
CI, we will discuss how we get p', the
distribution for the confidence interval, and EBP.
Remember that p' is the point estimate for the
unknown population proportion p.
p' is defined as the number of successes, x, in a
sample divided by the total, n, in the sample. The
equation for p' is:

The distribution that is used for the confidence
interval is normal. Think back to Lesson 4 and
remember the binomial distribution with parameters
n and p. p is defined as the probability of a
success for any trial (and q is the probability of
a failure for any trial: p + q = 1). If X is the
binomial random variable, then X ~ B (n, p).
If n is at least 20 and (n)(p) > 5 and (n)(q)
> 5, then X has an approximate normal
distribution and, as n gets larger, the
approximation gets better. In fact, if n is large
enough,

Now, if we take each x of the random variable X
and divide it by n, we get estimated proportions.
In the distribution above, we must also divide the
mean and the standard deviation by n. So,

Let X/n = P', the random variable for estimated
proportions and we get the distribution:

EBP, the error bound for the proportion, has an
equation similar to EBM, the error bound for the
mean (see the previous two sections, 8.2 and 8.3).
Remember that EBM is equal to a z-score or a
t-score multiplied by a standard deviation. EBP
has a similar format. Since the distribution is
normal, we use a z-score. The standard deviation
is:

But, we do not know p and q. So, we estimate them
with p' and q' and use the estimated standard
deviation:

Then,

Remember that the z-score depends on the
confidence interval.
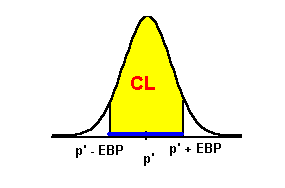
To get the CI, we subtract EBP from p' for the
lower value and add EBP to p' for the upper value.
The graph illustrates the CI in blue.

Back to Top
Confidence Interval
Problems Using TI-83 or TI-84 calculators
Example: In a survey of 80 males, 55 had played
an organized sport growing up. Construct a 99% CI
for the true population proportion of males who
played an organized sport growing up. Interpret
the CI.
The important numbers are the:
- sample size of 80,
- number of successes, 55
- 99% confidence interval.
The answer is (0.55401, 0.82099) using TI-83 or
TI-84 calculators. The functions to use are
STAT TESTS A: 1-PropZint.
- x: 55
- n: 80
- C-Level: 99
- Calculate
We can interpret the confidence interval in two
ways:
- We are 99% confident (or sure) that the true
population proportion of males who played
organized sports growing up is between 0.55 and
0.82 (from 55% to 82%).
- If we constructed many of these CIs, 99% of
them would contain the true population
proportion of males that played organized sports
growing up.
Example
The following
example is about a CI for the true
population proportion of families that have
children who swim on a swim team at a local cabana
club. This example shows you the TI-83 keystrokes.
Close the window when you are finished viewing the
example.
Think About It
- When a study gives a margin of error of + or-
4 percentage points, this is determined before
the survey is done. Since p' and q' are unknown,
what is the most conservative choice we can make
for them? (You can find the answer in Introductory
Statitics.) Why would we make these
choices?
- In a survey of 100 taxpayers, 20 feel that a
tax rebate is a good idea. What is the point
estimate for the true proportion of taxpayers
who feel that a tax rebate is a good idea?
This is the last section of this lesson. When you
have completed the assignment and the quiz for
Lesson 8, you are ready to begin Lesson 9 -
Hypothesis Testing: Single Mean and Single
Proportion.
Up » 8.1
Confidence Intervals »
8.2 Confidence Intervals
- Known » 8.3 Confidence Intervals
- Unknown » 8.4
Confidence Interval for a Single Population
Proportion
|