| 
                    
                       
                    Lesson 11.2 Chi-Square Goodness-of-Fit Test 
                    Goodness-of-Fit
                    In a chi-square goodness-of-fit hypothesis test,
                      you determine whether or not data "fit" a
                      particular distribution.  
                    For example, you might want to know if a
                      particular coin is fair. You could take data by
                      flipping the coin twice for 100 times. If the coin
                      is fair, the expected distribution is 25 HH, 25
                      HT, 25 TH, and 25 TT where H = heads and T =
                      tails. You could run a chi-square goodness-of-fit
                      hypothesis test to see if the outcomes from your
                      data "fit" the expected distribution. 
                    We write the null and alternate hypotheses in
                      sentences. 
                    Example: 
                     Ho: The coin is fair.
                      Ha: The coin is not fair. 
                      
                    
                    Notation
                    The test statistic for a goodness-of-fit test is: 
                       
                    O = the observed values (data). 
                    E = the expected values (the values you would
                      expect if the null hypothesis were true). 
                    n = the number of different data cells or
                      categories. 
                    The degrees of freedom df = n - 1. 
                    The test statistic is a measure of how far the
                      observed values (O) are from the expected values
                      (E) and is either 0 or positive. If the test
                      statistic is large, then the observed values are
                      far from what we would expect if Ho
                      were true. So, we would reject Ho.  
                    The goodness-of-fit test is almost always
                      right-tailed. 
                    
                    Hypothesis Testing Problems
                      Using TI-83 or TI-84 calculators
                    Example: The percentage of
                      students who attend a local school in any given
                      school week is as follows: 


                            | 
                               Monday 
                             | 
                            
                               Tuesday 
                             | 
                            
                               Wednesday 
                             | 
                            
                               Thursday 
                             | 
                            
                               Friday 
                             | 
                           
                          
                            | 
                               95% 
                             | 
                            
                               96% 
                             | 
                            
                               98% 
                             | 
                            
                               97% 
                             | 
                            
                               95% 
                             | 


                    In one given school week, the number
                      of students (data) who attended school out of a
                      student population of 500 was:   


                              | 
                                 Monday 
                               | 
                              
                                 Tuesday 
                               | 
                              
                                 Wednesday 
                               | 
                              
                                 Thursday 
                               | 
                              
                                 Friday 
                               | 
                             
                            
                              | 
                                 450 
                               | 
                              
                                 470 
                               | 
                              
                                 485 
                               | 
                              
                                 480 
                               | 
                              
                                 470 
                               | 


                    Perform a goodness-of-fit hypothesis test to
                      determine if the numbers fit the
                      percentages given. 
                    Formulate the 2 hypotheses. 
                    Ho: The number of students who attend
                      the local school Monday through Friday fit the
                      expected percentages. 
                    Ha: The number of students who attend
                      the local school Monday through Friday do not fit
                      the expected percentages. 
                    Determine the random variable and the
                      distribution for the test. 
                       
                    There are 5 cells or categories (Monday, Tuesday,
                      Wednesday, Thursday, Friday).  
                    df = 5 - 1 = 4. 
                    Using the test statistic calculated from the
                      data, calculate the p-value. 
                    TI-83 calculator: 
                    
                      - Clear List L1. It will contain the data or
                        observed numbers ( O). Enter 450, 470, 485, 480,
                        470.
 
                      - Clear list L2. It will contain the expected
                        numbers (E). Enter the following: 500*.95,
                        500*.96, 500*.98, 500*.97, 500*.95.
 
                      - Clear list L3. Arrow up into the name area
                        (L3) at the top. Press (L1-L2)2/L2
                        and ENTER.
 
                      - Press 2nd QUIT. Clear the home screen.
 
                      - Press 2nd LIST MATH 5:sum(
 
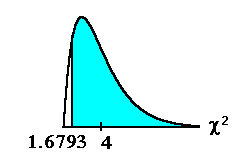
                      - Press L3) and ENTER. You should see 1.6793 to
                        4 decimal places. This is the chi-square
                          test statistic.
 
                      - Press 2nd DISTR 7: C2cdf(.
 
                      - Enter 1.6793,1EE99, 4). You should see 0.7945
                        to 4 decimal places. This is the p-value.
 
                     
                    Compare α and the p-value and make a decision.  
                     Assume α = 0.05
                      Since 0.05 < 0.7945 (α< p-value), we do
                        not reject Ho. 
                    
                    Because the p-value is so large, the test
                      strongly favors the null hyothesis. 
                       
                    Write an appropriate conclusion. 
                    We conclude that the numbers of students who
                      attend the local school Monday through Friday fit
                      the expected percentages.  
                     Example 
                    The following
                        problem is a chi-square goodness-of-fit
                      hypothesis testing problem. Close the window when
                      you are finished viewing the example. You will
                      return here. 
                    Think About It 
                    Do the Try-It examples in Introductory
                        Statistics. Verify the numbers. The
                      calculator instructions follow the problem. 
                    Please continue to the next section of this
                      lesson.  


                    Up » 11.1
                        Chi-Square Probability  » 11.2
                      Chi-Square Goodness-of-Fit Test »
                        11.3 Chi-Square Test of Independence 
                    
                   |