Lesson 1.1 Statistics
What is Statistics?
The science of statistics involves ...
- collection of data
- analysis of data
- interpretation of data
- presentation of data
We can use statistics to better understand what goes on around us in our lives.
For example, if we notice that a lot of students in our class seem tired, we might be interested in finding out the average number of hours each student is sleeping every night.
Collection of Data
First, data must be collected.
In the above example of tired students, if we want to find out the average amount of time students sleep per night, we could collect data from our classmates.
First, each person would keep a diary, in which he or she writes down the number of hours he or she sleeps every night for two weeks. Then we would ask each person to report his or her results.

Analysis of Data
Next, the data is analyzed.
We could analyze the data from our sample class by finding the average time each student slept over a certain period of time, say two weeks. The following table shows how much time one particular student, Susan, slept each night for two weeks.
How many hours per night did Susan sleep the last two weeks? |
M
8
7.5
|
T
6.5
7
|
W
7
6.5
|
Th
7.5
6
|
F
7.5
8
|
Sa
8.5
9
|
Su
8.5
7.5
|
Total number of hours: |
= 105
|
Total number of nights: |
= 14
|
Average number of hours per night: |
105 hours
14 nights
|
105
14
|
7.5 hours/night
|
Interpretation of Data
Then, data needs to be interpreted.
One interpretation of our sample data might be that most students sleep less than 8 hours per night on the week nights and more on weekends.
Presentation of Data
Finally, data can be presented.
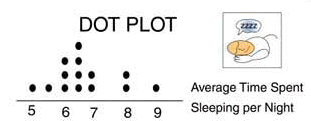
We could present the sleep averages for all the students in a dot plot (see below), a graphic representation where the occurences of data are represented by dots plotted in a graph.

Please continue to the next section of this lesson.
|