|
Find the probability that one randomly
chosen student waits more than 6 minutes
in line at the campus store at the
beginning of the term.
P(X > 6) = 0.3085.
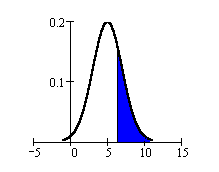
The probability that one randomly
chosen student waits more than 6 minutes
is 0.3085. This calculation was done
using TI-83 or TI-84 calculator function
2nd DISTR 2:normal CDF (6, 1EE99, 5, 2).
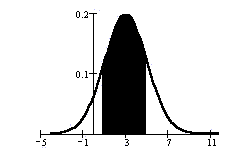
Find the probability that one randomly
chosen student waits between 3 and 6
minutes in line at the campus store at
the beginning of the term.
P(3 < X < 6) = 0.5328
.
The probability that one randomly
chosen student waits between 3 and 6
minutes is 0.5328.
This calculation was done using TI-83
or TI-84 calculator function
2nd DISTR 2:normalcdf(3, 6, 5, 2)
Find the 3rd quartile. The third
quartile is equal to the 75th
percentile.
Let k = the 75th percentile (75th
%ile).
P(X < k ) = 0.75.
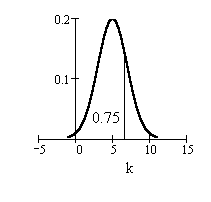
The 3rd quartile or 75th percentile is
6.35 minutes (to 2 decimal places).
Seventy-five percent of the waiting
times are less than 6.35 minutes.
This calculation was done using TI-83
or TI-84 calculator function
2nd DISTR 3:invNorm(.75, 5, 2)
|