|

Lesson 6.2 The Standard Normal Probability
Distribution
Standard Normal
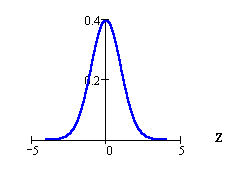
The standard normal distribution is a normal
probability distribution of standardized values
called z-scores. The standard normal has a mean of
0 and a standard deviation of 1. Z is commonly
used as the random variable.
Notation: Z ~ N(0, 1)

If you had two sets of values such that each set
followed a normal distribution but the mean and
standard deviation of the first set is different
from the mean and standard deviation of the second
set, then you could use the standard normal
distribution to standardize the values so that you
could compare the two different sets.
Z-Scores
The formula for a z-score is:

where x is the value that is being standardized.
A z-score is measured in terms of the standard
deviation.
So, if z = 2, then 2 is the standardized score
for the value of X that is 2 standard deviations
above (positive z-score) the mean.
If z = -1, then -1 is the standardized score for
the value of X that is 1 standard deviation below
(negative z-score) the mean.
Some z-score problems:
|
Suppose X follows a normal distribution
with mean = 100 and standard deviation =
5. Then X ~ N(100, 5). Find the z-score
for x = 95 and x = 110.
Use the z-score formula from above.
If x = 95, then z =

If x = 110, then z =

Suppose X = the amount of weight a
person loses, in pounds, using weight
loss plan A and Y = the amount of weight
a person loses, in pounds, using weight
loss Plan B. X and Y each follow a
normal distribution.
X ~ N(5, 6). The mean is 5 pounds and
the standard deviation is 6 pounds.
Y ~ N(2, 1). The mean is 2 pounds and
the standard deviation is 1 pound.
x = 17 pounds and y = 4 pounds are each
2 standard deviations from their
respective means because
z = (17 - 5)/6 = 2 and
z = (4 - 2)/1 = 2.
|
Close the window when you are finished. You will
return here.
Think About It
Do the Try-It examples in Introductory Statistics.
Please continue to the next section
of this lesson.
Up » 6.1 Normal Probability
Description » 6.2
Standard Normal Probability »
6.3 Normal Probability
|