|

Lesson 11.1 The Chi-Square Probability
The Chi-Square Distribution
Public high school administrators often wonder if absences occur with equal frequency among the students for each day of the school week. Car manufacturers are interested in whether car size depends on the size of the family. The public high school administrators and the car manufacturers, both could benefit by conducting chi-square hypothesis tests.
For this course, you will learn two applications of the chi-square distribution:
- the goodness-of-fit hypothesis test which determines if data fits a particular distribution. The public school administrators would use a goodness-of-fit test.
- the hypothesis test of independence which determines if two factors are independent or not. The car manufacturers would use a test of independence.
Notation
The notation for the chi-square distribution is:

where df is the degrees of freedom and depends on how chi-square is used.
The random variable is:

The mean and standard deviation of the chi-square distribution are:

Facts About Chi-Square
There is a different chi-square curve for each df.
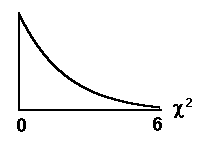
Example: df = 2


The graph is skewed to the right.
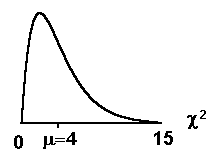
Example: df = 16


The graph is skewed to the right.
Example: df = 90


When the dfs are larger than 90, the curve approximates the normal.
- The curve is not symmetrical. It is skewed to the right.
- To perform a hypothesis test, we calculate a chi-square test statistic. The test statistic is always greater than or equal to 0.
- The mean, μ, is located just to the right of the peak.
 NOTE: We use technology (TI-83 or TI-84 calculators) to perform the calculations for a goodness-of-fit test and for a test of independence
Please continue to the next section of this lesson.
Up » 11.1 Chi-Square Probability » 11.2 Chi-Square Goodness-of-Fit Test » 11.3 Chi-Square Test of Independence
|