| Elementary Statistics |
| |Sofia Home | Content Gallery | |
|
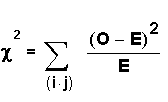
We generally write the null and alternate hypotheses in sentences. Example: Ho: Pie preference and gender are independent. Ha: Pie preference and gender are not independent. Back to TopNotationThe test statistic for a test of independence is:  O = the observed values (data). E = the expected values (the values you would expect if the null hypothesis were true). i = the number of rows in the contingency table. j = the number of columns in the contingency table. The degrees of freedom df = (i - 1)(j - 1). The test statistic is a measure of how far the observed values (O) are from the expected values (E) and is either 0 or positive. If the test statistic is large, then the observed values are far from what we would expect if Ho were true. So, we would reject Ho. The test of independence is right-tailed. The following formula calculates the expected value: "Row total" and "column total" represent the totals of the row and the column of a particular cell in the table. Example: In the example above, find the expected value for being male and preferring pumpkin pie. Row total for being male = 40 + 10 + 30 = 80 Column total for preferring pumpkin pie = 10 + 30 = 40 Total number surveyed = 40 + 10 + 30 + 20 + 30 + 10 = 140  We expect 22.9 of the males to prefer pumpkin pie. It is OK for the answer to be a decimal because it is an expected value. Back to TopHypothesis Testing Problems Using TI-83 or TI-84 calculatorsExample: The following table provides data from a study of 128 students at De Anza College in Cupertino, California, USA. A researcher wanted to know if their age had anything to do with the perceived difficulty of the Elementary Statistics class at the college. The researcher asked the students if they thought that the elementary statistics course was more difficult, the same difficulty, or less difficult than other math courses they had taken.
Elementary Statistics is
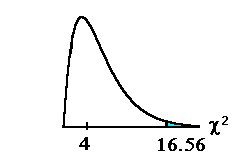
The researcher wants to know if age of the student and perceived difficulty of the Elementary Statistics course are independent. Formulate the 2 hypotheses. Ho: Age of the student and perceived difficulty of the elementary statistics class are independent. Ha: Age of the student and perceived difficulty of the elementary statistics class are not independent. Determine the random variable and the distribution for the test. There are 3 rows and 3 columns. df = (3 - 1)(3 - 1) = 4 Using the test statistic calculated from the data, calculate the p-value. TI-83 calculator:
Compare α and the p-value and make a decision. Since 0.05 > 0.0023 (α> p-value), we reject Ho. Because the p-value is so small, the test is strongly against the null hyothesis.  Write an appropriate conclusion. We conclude that the age and perceived difficulty of the Elementary Statistics class are not independent. The perceived difficulty of the class depends upon the age of the student. Expected Value Calculation: To calculate the expected value for the 25 - 45 year old age group who feel they have more difficulty, we use the expected value formula: The 25 - 45 year old age group row has a total of 18 + 28 + 5 = 51. The more difficult column has a total of 22 + 18 + 16 = 56.  to 1 decimal place. We expect 22.3 students who are 25 - 45 to find the course more difficult. Example The next example is a hypothesis test to determine if the factors gender and hiking preference are independent. Close the window when you are finished viewing the example. You will return here. Back to TopThink About ItDo the Try-It examples in Introductory Statistics. Verify the numbers. The calculator instructions follow the example. This is the last section of this lesson. Back to Top
Up » 11.1 Chi-Square Probability » 11.2 Chi-Square Goodness-of-Fit Test » 11.3 Chi-Square Test of Independence |