|

Lesson 5.1
Continuous Probability Distribution Functions
Continuous Probability Distribution Function
A continuous probability function f(X) is a special mathematical function used in calculating probabilities. The function f(X) is always greater than or equal to zero and the area between (X) and the x-axis is equal to a probability.
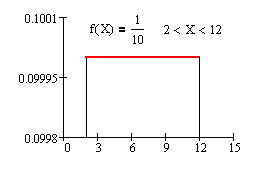 X X
The largest probability is 1 and the smallest probability is 0. The area between f(X) and the horizontal x-axis is no larger than 1 and no smaller than 0.
Continuous Random Variable
A continuous random variable X takes on values that are measured. Individual values of X cannot be listed, just intervals.
Examples:
- Let X = the amount of time a customer stands in line for the ATM machine.
- Let X = a baseball major league batting average.
- Let X = the age of a high school senior the day he or she graduates.
- Let X = the cost of maintenance of a new car during its first year.
Comparison of Discrete and Continuous Random Variables
A discrete random variable represents outcomes that you COUNT.
A continuous random variable represents outcomes that you MEASURE.
In a discrete graph, the height of a bar is equal to probability.
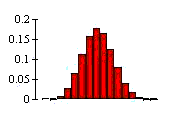
In a continuous graph, probability is equal to the area under the function f(X) and above the x-axis.
PROBABILITY = AREA
P(X < x) = area to the left of x where x is on the horizontal axis in an x-y graph.
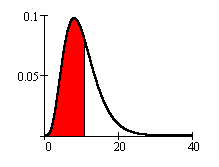
P(X > x) = area to the right of x.
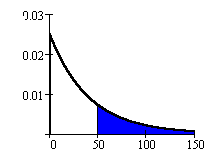
P(a < X < b) = the area between a and b which are on the horizontal axis.
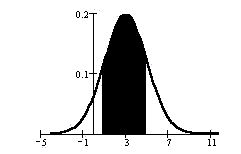
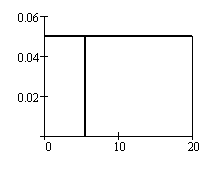
Because probability = area, P(X =one x-value) = 0.
 X X
Recall that X =x-value is a vertical line and has no area.
Please continue to the next section of this lesson.
Up » 5.1 Continuous Probability » 5.2 Uniform Probability » 5.3 Exponentrial Probability
|