|
Find the long term average.
m = (a + b)/2 = (0 + 10)/2 = 5 minutes
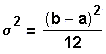
Find the Standard Deviation.
s = the square root of [(b - a)2/12]
= the square root of
(10 - 0)2/12 = 2.9 minutes
Find the probability that a college
student must wait less than 3 minutes.
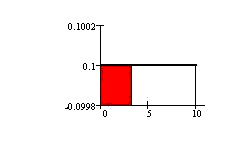
P(X < 3) = (base)(height) = (3 -
0)(1/10) = 3/10.
Find the probability that a college
student must wait between 3 and 7
minutes.
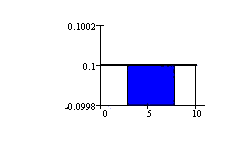
P(3 < X < 7) = (base)(height) =
(7 - 3)(1/10) = 4/10.
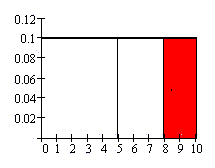
Find the probability that a college
student must wait more than 8 minutes.
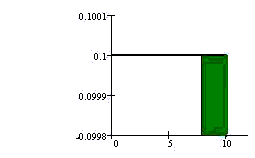
P(X > 8) = (base)(height) = (10 -
8)(1/10) = 2/10.
Find the probability that a college
student must wait exactly 8 minutes.
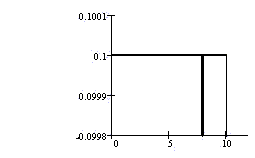
P(X = 8) = (base)(height) = (0)(1/10) =
0.
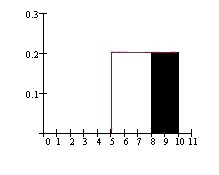
Find the probability that a college
student must wait more than 8 minutes
when the college student has already
waited more than 5 minutes.
Notice that the graph starts at X = 5
because we know that the college student
has already waited more than 5 minutes.
This is a conditional probability
(studied in Lesson 3). The base of the
rectangle is no longer 10 - 0 = 10 but
10 - 5 = 5. Since the maximum area must
be 1, the new height is 1/5.
P(X > 8|X > 5) = (base)(height) =
(10 - 8)(1/5) = 2/5.
Another way to do the problem is to use
the conditional probability equation
with the original function f(X) = 1/10
where 0 < X < 10:
P(A|B) = P(A AND B) / P(B).
In this case A is X > 8 and B is X
> 5.
So, P(X > 8|X > 5) = P(X > 8
AND X > 5) / P(X > 5) = P(X >
8) / P(X > 5) = [2/10] / [5/10] =
2/5.
Find the 90th percentile (find the
waiting time that has 90% of all other
waiting times falling below it).
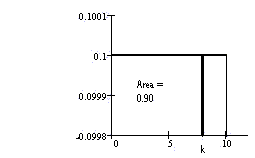
Let k = the 90th percentile. The area
to the left of k is 0.90 (remember, the
largest area is 1). AREA =
(base)(height). So, 0.90 = (k - 0)(1/10)
(0.90)(10) = (k)(1/10)(10)
9 minutes = k
90% of the waiting times fall below 9
minutes. Another way to say this is that
90% of the time, a college student must
wait less than 9 minutes.
|