|

Lesson 5.3 The Exponential Probability
Distribution
Characteristics of the
Exponential
In the real world, the exponential is often the
distribution of the amount of time until a
specific event occurs. For example, the length of
time, in minutes, of a long distance business
phone call follows an exponential distribution.
There are more phone calls that last a shorter
amount of time and fewer calls that last a long
time.
The amount of money a customer spends for one
trip to the supermarket also follows an
exponential distribution. There are more people
that spend less money and fewer people that spend
large amounts of money.
The exponential distribution is used widely in
the field of reliability. Reliability deals with
the amount of time a product lasts.
Notation and Formulae
The function is f(X) = me-mx
where m is a constant number known as the
parameter of decay. The number e is equal to
2.71828182846.... X is 0 or greater.
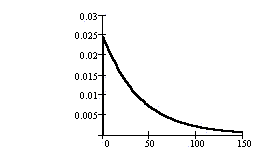
In the graph, μ = 0.025.
Notation: X ~ Exp(m)
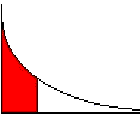
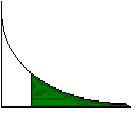
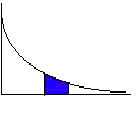
Probability = AREA under the curve:
Area to the left: P(X < x) = 1-e-mx
Area to the right: P(X > x) = e-mx
Area between a and b: P(a < X < b) = e-ma-e-mb
Mean: μ = 1/m
( M and μ are reciprocals)
Standard Deviation: σ = μ
(the mean and standard deviation are the
same)
Example
The length of time a randomly chosen 11-year old
spends playing video games per day is
approximately exponentially distributed with a
mean equal to 1.5 hours.
Let X = the amount of time, in hours, a randomly
chosen 11-year old plays video games per day.
Since μ = 1/m = 1.5 = 3/2, then m = 2/3
X ~ Exp(2/3)
f(X) = (2/3) e-(2/3)x
Below are some typical problems:
|
Find the long term average.
μ = 1.5 hours (given in the problem)
Find the standard deviation.
σ = μ = 1.5 hours
Find the probability that an 11-year
old spends more than 1.5 hours playing
video games per day.
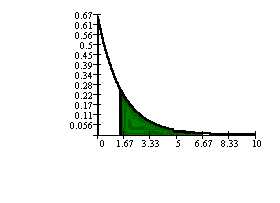
P(X > 1.5) = e-(2/3)(1.5)
= 0.3679
Find the probability that an 11-year
old spends less than 1.5 hours playing
video games per day.
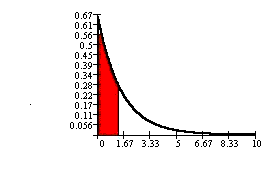
P(X < 1.5) = 1 - e-(2/3)(1.5)
= 0.6321
(Notice that 0.6321 = 1 - 0.3679)
Find the probability that an 11-year
old spends between 1 and 1.5 hours
playing video games per day.
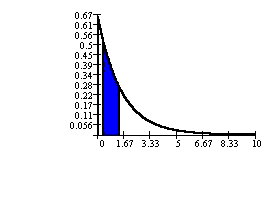
P(1 < X < 1.5) = e-(2/3)(1)
- e-(2/3)(1.5)
= 0.1455
Ninety percent of 11-year olds spend
less than how long playing video games
per day? (Find the 90th percentile.)
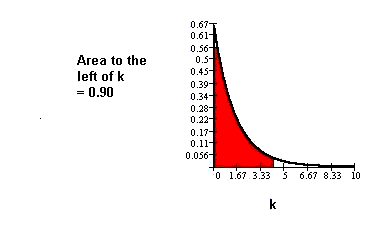
Let k = the 90th percentile. The area
to the left of k is 0.90 (remember, the
largest area is 1).
k = LN(1 - AreaToTheLeft) / (-m)
(This formula is the
inverse of P(X < x) = 1 - e-mx.)
AreaToTheLeft = P(X <
x).
Since we want to find the 90th
percentile, the area to the left is
0.90. So,
k = LN(1 - 0.90) / (-2/3) = 3.45 hours.
Ninety percent of the 11-year olds
spend less than 3.45 hours playing video
games per day.
|
Exponential Problem
Using TI-83 or TI-84 calculators
Example
The
following example has to do with the amount
of time a car battery lasts. The time, in months,
follows an exponential distribution. We use TI-83
or TI-84 calculators for the calculations. Close
the window when you are finished viewing the
example.
Think About It
Do Try-It examples in Introductory
Statistics.
This is the last section of this lesson. When you
have completed the assignment and the quiz for
Lesson 5, you are ready to begin Lesson 6 - The
Normal Distribution.
Up » 5.1
Continuous Probability »
5.2 Uniform Probability »
5.3 Exponentrial Probability
|