|

Lesson 8.1 Confidence Intervals in General
Confidence Intervals
Confidence Intervals are a part of inferential statistics, the science of drawing statistical conclusions from specific data. We create confidence intervals for unknown population parameters, such as the population mean or population proportion. A confidence interval (CI) is another way to estimate a population parameter like the population mean. (Remember that the sample mean is a way of estimating the population mean. A confidence interval is just another way.)
During an election, the media continually report CI's to us. For example, when a news article says, "Forty-seven percent of voters in the county favor candidate A. The margin of error is plus or minus 3 percentage points," it is referring to a CI. The CI is
(47% - 3%, 47% + 3%) = (44%, 50%)
The interpretation is that between 44% and 50% of voters in the county favor candidate A.

A CI is created with a certain amount of "confidence" or certainty. We call the confidence a "confidence level" CL.
For example, a poll taker might be 95% confident (polls typically use a 95% confidence level) that 47% of voters in the county favor candidate A with a margin of error of plus or minus 3 percentage points (polls also typically construct CIs to have "3 percentage points" as the margin of error). This means that the poll taker is 95% sure that the true proportion of voters in the county is between 44% and 50%.
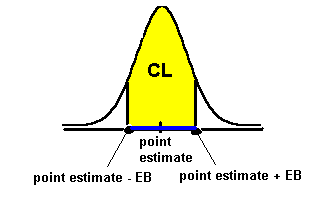
A confidence interval has the format:
(point estimate - margin of error, point estimate + margin of error)
The point estimate is calculated from the data. You are already familiar with the sample mean. It is a point estimate for the true population mean, μ. Another type of point estimate is an estimated proportion, p'. It is an estimate from a sample for the true population proportion, p, and is calculated by dividing the proportion of "successes" by the total in the sample.
In this lesson, we use the point estimates sample mean and estimated proportion in the calculation of confidence intervals
Back to Top
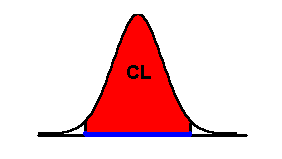
Confidence Interval Graph
The two graphs below show the CI in blue. Above the CI is the area known as the confidence level (CL). As the CL gets larger, the CI gets larger, too. If you look at the second graph, you can see that a larger CL produces a larger CI.
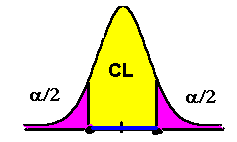
The following graph shows CL and alpha, α.
CL + α/2 + α/2 = 1.
α is our " unconfidence" or uncertainty. For example, if a 95% CI for the true proportion of voters in the county who favor candidate A is (44%, 50%), then there is a 5% chance that the proportion is not between 44% and 50%.
If we had constructed 100 of these 95% CIs, 5% or 20 of them would not contain the true proportion of voters in the county who favor candidate A.
Back to Top
Confidence Interval Steps
- Decide on your level of confidence, CL.
- Decide on your sample size.
- Gather your data.
- Calculate the correct point estimate (either the sample mean or the sample proportion).
- Calculate the margin of error (there are special formulae depending on the type of CI). The margin of error is generally abbreviated as EB (error bound). We use EBM as the error bound for the mean and EBP as the error bound for the proportion.
- Use the format (point estimate - margin of error, point estimate + margin of error) for the CI.
- Interpret your CI in complete sentences.
NOTE: We use technology (TI-83 or TI-84 calculators) to calculate confidence intervals in the next three sections of this Lesson. We limit our discussion to CIs of a single population mean and a single population proportion.
Think About It:
Try the following experiment. Spin a coin on its edge 20 times and count the times it lands heads. Then, calculate the percentage of heads (number of times coin lands heads divided by 20 multiplied by 100). Just for now, suppose you have an error bound of 2%. What is your CI? How confident are you that the true proportion of heads is contained within your CI (70%, 80%, 90%, 95%, 99%, or some other percentage - take a guess)?

Please continue to the next section of this lesson.
Up » 8.1 Confidence Intervals » 8.2 Confidence Intervals - Known » 8.3 Confidence Intervals - Unknown » 8.4 Confidence Interval for a Single Population Proportion
|