Notation and Formulae
Remember that the CI format is:
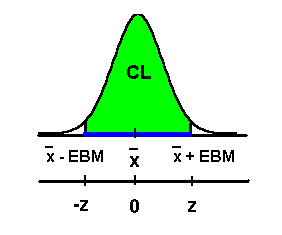
(point estimate - EB, point
estimate + EB)
where EB is the margin of error or error bound.
In a CI for a single population mean where the
population standard deviation is known, the
point estimate is the sample mean and the error
bound is the error bound for the mean. So, the
CI has the format:

Even though we use technology to calculate the
CI, we will discuss how we get EBM.
Remember that the distribution of sample means
is approximately normal by the Central Limit
Theorem (CLT). The standard deviation for sample
means is the standard error of the mean:
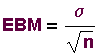
To get the error bound for the mean (EBM), we
multiply the standard error of the mean by a
z-score that depends on the confidence level.
To get the idea, suppose CL = 0.95. You can
find the z-score that corresponds to this CL by
using a normal probability table or by using
technology. Notice that z corresponds to the
upper number of the CI and -z corresponds to the
lower number of the CI.
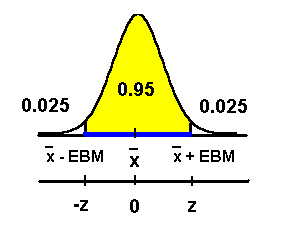
The two white areas under the curve in the
graph are called "tails." Since the area under
the curve is 1, each tail must have an area
equal to 0.025. The area to the left of -z is
0.025. Remember that z-scores follow a normal
distribution with a mean of 0 and a standard
deviation of 1. We can find -z by using TI-83 or
TI-84 calculator invNorm function. Use
STAT TESTS 3:invNorm(.025, 0,
1).
This gives us -z = -1.96 (to 2 decimal places).
So, z = 1.96 and
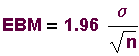
NOTE: The error bound is always
positive. We just subtract it from and add it
to the point estimate to get the CI.
Confidence Interval
Problems Using TI-83 or TI-84 calculators
Example: In today's world, teenagers like to
use instant messaging on the internet to
communicate with their friends. In a sample of
100 teenagers, the average amount of time they
spent per day using instant messaging was 2
hours. Suppose the standard deviation is known
to be 1 hour. Construct a 95% CI for the
population mean time spent per day by teenagers
using instant messaging on the internet.
Interpret the CIl.
The important numbers are the
- sample size of 100,
- sample mean 2 hours,
- population standard deviation 1 hour,
- 95% CI.
The answer is (1.804, 2.196) using TI-83 or
TI-84 calculators.
Use STAT TESTS 7:Z interval.
- Inpt:Stats
- s: 1
- xbar: 2
- n:100
- C-Level: 95
- Calculate
We can interpret the CI in two ways:
- We are 95% confident (or sure) that the
population mean of times spent by teenagers
per day using instant messaging on the
internet is between 1.8 hours and 2.2 hours
(rounded to 1 decimal place).
- If we constructed many of these CIs, 95% of
them would contain the population mean of
times spent by teenagers per day using instant
messaging on the internet.
Example
The
following example is concerned with
statistics exams scores where the population
standard deviation is known. This example shows
you the TI-83 keypad and the keystrokes. Close
the window when you are finished viewing the
example.
Think About It
- What distribution do you use for a CI for a
mean when the population standard deviation is
known?
- If we increase the sample size and keep all
other numbers the same, does the CI get larger
or smaller?
- If we know the population standard deviation
and we can calculate the sample standard
deviation, which standard deviation would we
use in the calculation of the confidence
interval?
Please continue to the next section of this
lesson.