|

Lesson 8.3 Confidence Interval for a Population
Mean – Unknown Population Standard Deviation
Notation and
Formulae
Remember that the CI format is:
(point estimate- EB, point estimate + EB)
where EB is the margin of error or error bound.
In a CI for a single population mean where the
population standard deviation is unknown, the
point estimate is the sample mean and the error
bound is the error bound for the mean. So, the CI
has the format

We use the same syntax as we did in the CI for a
single population mean where the population
standard deviation is known. What is different is
how we calculate the error bound EBM.
In the real world, you typically calculate a CI
from data. The population standard deviation is
not known. In the past, there was no problem in
estimating the population standard deviation with
the sample standard deviation and using the
Central Limit Theorem (when the sample size was
large (bigger than 30). Before the general
population had access to technology, the Standard
Normal Distribution applied. The problem came when
the sample size was small. In this case, we use a
new distribution called the Student-t, created by
William Gossett, its inventor. (Gossett wrote
about the Student-t distribution using the
pseudonym "Student.")
Now, since we have strong, available technology,
we use the Student-t Distribution whenever the
population standard deviation is unknown and we
are estimating it with s. The sample size does not
matter. See Introductory Statistics for a
detailed explanation.

The Student-t is a distribution of t-scores (very
much like z-scores). If T is the random variable
representing t-scores, then the notation for the
student-t distribution is:

The subscript df is short for "degrees of
freedom." it is equal to the sample size - 1.
df = n - 1
The equation for a t-score is:

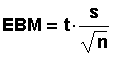
We get EBM similar to the way we get EBM for the
case where the population standard deviation is
known but we use s in place of >s and t in
place of z.
Remember that we subtract from and add to the
sample mean to get the CI. In the past, the
t-scores were looked up in a very limited table.
The limitation was put on the CLl. Today,
technology can easily calculate a CI for any CL.
Confidence Interval
Problems Using TI-83 or TI-84 calculators
Example: Ten engineers working for start-up
companies were asked how long they worked, in
hours, per week. The data (in hours) is 70, 45,
55, 60, 65, 55, 55, 60, 50, 55. Construct a 90% CI
for the population average length of time, in
hours, that engineers at start-ups work per week.
Interpret the CI.
The important numbers are the
- the data AND
- 90% confidence interval.
Since we only have data, we use a Student-t
distribution. The population standard deviation is
not known.
The answer is (52.856, 61.144) using TI-83 or
TI-84 calculators.
First, enter STAT 1:EDIT. Then, clear list L1
by arrowing up to the list name, pressing CLEAR,
and arrowing down.
Enter the data. The functions to use are:
STAT TESTS 8:Tinterval
Inpt:Data
List: L1
Freq: 1
C-Level: 90
Calculate.
We can interpret the CI in two ways:
- We are 90% confident (or sure) that the
population average length of time, in hours,
that engineers at start-ups work per week
(rounded to 1 decimal place) is between 52.9 and
61.1 hours.
- If we constructed many of these CIs, 90% of
them would contain the population average length
of time, in hours, that engineers at start-ups
work per week.
Example
Most people
like French fries. In the example, only data
is given so that the population standard deviation
is unknown. This example shows you the TI-83
keypad and the keystrokes. Close the window when
you are finished viewing the example.
Think About It
- What distribution do we use for a CI for a
mean if we only have data? Do we know the
population standard deviation?
- If the CL is made smaller, does the CI get
larger or smaller?
Please continue to the next section of this
lesson.
Up » 8.1
Confidence Intervals »
8.2 Confidence Intervals
- Known » 8.3
Confidence Intervals - Unknown »
8.4 Confidence Interval
for a Single Population Proportion
|