10.1 Hypothesis Testing for Two Population Means
Hypothesis Testing for Two Population Means,
Independent Groups
The distribution for a hypothesis test of two
population means, independent groups, is the
Student-t when the population standard deviations
of the two groups are unknown or the normal if the
population standard deviations are known. Knowing
the population standard deviations is highly
unlikely.
The statistic is the difference between the
sample means of the two groups calculated from the
data. If we call the groups group 1 and group 2,
then the random variable is:

and the statistic is:

(read as "xbar1 minus xbar2")
where

(read as "xbar1")
is the sample mean of the sample taken from group
1 and

(read as "xbar2")
is the sample mean of the sample taken from group
2.
The two independent groups are
populations that are normally distributed.
When the null hypothesis is that there is no
difference between the population group means, we
write Ho as
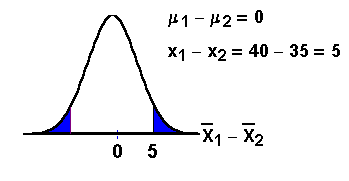
μ1 - μ2 = 0
Depending on the test, Ho may be
written as
or

If Ho is μ1 - μ2
= 0, then we are testing μ1 = μ2.
For the other cases, we could write:

and

Hypothesis Testing Problems
Using TI-83 or TI-84 calculators
Example:
Companies that produce the same type of product
often compare their products. In one particular
test, the number of M & M's (registered
trademark) plain candies were compared to the
number of Reeses Pieces (registered trademark). In
a sample of 40 small packages of M & Ms, the
sample mean was 57.7 candies with a sample
standard deviation of 2.1 candies. In a sample of
35 packages of the same size of Reeses Pieces, the
sample mean was 52.6 candies with a sample
standard deviation of 2.4 candies. The populations
of the number of M & M's candies in a small
package and the number of Reeses Pieces in the
same size package are normal.
Conduct an appropriate hypothesis test to
determine whether or not the average number of
candy pieces per package is the same for the two
brands. Use a level of significance of 0.01.
The important numbers are:
- for the M & M's
candies, sample mean = 57.7, sample standard
deviation = 2.1, sample size = 40, and
- for the Reeses Pieces,
sample mean = 52.6, sample standard deviation =
2.4, same size = 35.
Formulate the 2 hypotheses.
Let the M & Ms be group 1 and the Reeses
Pieces be group 2.
Ho: μ1 = μ2.

two-tailed test
Determine the random variable and the
distribution for the test.

Student-t because the population standard
deviations are unknown.
Using the statistic calculated
from the data, calculate the p-value.

Use TI-83 or TI-84 calculator functions.
STAT TESTS 4: 2-SampTTest.
Inpt: Stat
xbar1: 57.7
sx1: 2.1
n1: 40
xbar2: 52.6
sx2: 2.4
n2: 35
μ1: =/= μ2
Pooled: No
(To pool would be to combine the
sample standard deviations into one special
standard deviation. We do not need to do this.)
Calculate
The p-value (p) is 1.625151E-14 which is almost
0. (Reminder: 1.625151E-14 is equal to 1.625151
multiplied by 10-14.)
Compare α and the p-value and make a decision.
α= 0.01
Since 0.01 > 0 ( α> p-value), we reject Ho.
Write an appropriate conclusion.
We conclude that the there is a
difference between the average number
of M & Ms and Reeses Pieces in small packages
of the same size.
Example:
Two machines fill grated cheese packages. The
population standard deviations are known to be
0.80 ounces for machine A and 0.60 ounces for
machine B. Samples are selected from
each machine. The sample data is as follows:
|
---
|
Sample Size
|
Sample Mean
|
|
Machine A
|
32
|
8.2 ounces
|
|
Machine B
|
34
|
7.9 ounces
|
We are interested in determining whether the mean
content of packages filled by machine A is more
than the mean content of packages
filled by machine B. Conduct an appropriate
hypothesis test.
Formulate the 2 hypotheses.
Let packages from Machine A be
group 1 and packages from Machine B
be group 2.

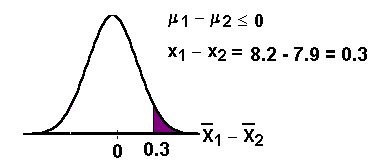
Ha:μ1> μ2.
right-tailed test
The random variable and the statistic are the
same as in the previous example.
Using the statistic calculated from the data,
calculate the p-value.

Use TI-83 or TI-84 calculator functions
STAT TESTS 3: 2-SampZTest.
Inpt: Stat
σ1: .8
σ2: .6
xbar1: 8.2
n1: 32
xbar2: 7.9
n2: 34
μ1: > μ2
Calculate
The p-value (p) is 0.0431 to 4 decimal places.
Compare α and the p-value and make a decision.
Assume α = 0.05
Since 0.05 > 0.0431 ( α> p-value), we do
reject Ho.
However, the test is weak because α and the
p-value are close.
Write an appropriate conclusion.
We conclude that the mean content of packages
filled by machine A more than
the mean content of packages filled by Machine B.
Example
The
following example is a hypothesis test for
two population means with population standard
deviations unknown. The average prices of two
laptops are compared. This example shows you the
TI-83 keypad and the keystrokes. Close the
window when you are finished viewing the
example. You will return here.
Please continue to the next section of this
lesson.
Up » 10.1 Hypothesis Testing for
Two Population Means » 10.2 Hypothesis Testing for
Two Population Proportions »
10.3 Hypothesis Testing for Matched or Paired
Samples
|