Lesson 10.3 Hypothesis Testing for Matched or
Paired Samples
Hypothesis Testing for Matched or Paired
Samples, General Information
The distribution for a hypothesis test of
matched or paired samples is the Student-t for a
single population mean.
Subjects are matched in pairs and two
measurements are taken for each pair. For each
pair of measurements, the difference is
calculated. These differences are the data that
are used in the hypothesis test.
The statistic is the sample mean of the
difference data. If we assign the subscript d to
the differences, then the random variable is:

and the statistic is:

The null and alternate hypotheses use:
μd
which is the population mean of the differences.
Hypothesis Testing Problems
Using TI-83 or TI-84 calculators
Example: Starting salaries for environmental
jobs, in dollars, for 5 positions requiring no
degree are as follows:
| Position |
1
|
2
|
3
|
4
|
5
|
| Salary |
32,000
|
25,000
|
54,000
|
40,000
|
45,000
|
The starting salaries for
the same position for persons holding a degree
in geography or computer science are:
| Position |
1
|
2
|
3
|
4
|
5
|
| Salary |
32,000
|
26,000
|
55,000
|
43,000
|
49,000
|
Use the difference data:
(salary earned with a degree -
salary earned without a degree)
to test the hypothesis that a person will earn a
higher starting salary for an environmental job
when he or she has earned a degree.
The important numbers are:
- the data for persons
without a degree, AND
- the data for persons with a
degree.
Calculate the differences:
- 32,000 - 32,000 = 0
- 26,000 - 25,000 = 1,000
- 55,000 - 54,000 = 1,000
- 43,000 - 40,000 = 3,000
- 49,000 - 45,000 = 4,000
The differences are the data to use in the
hypothesis test.
Formulate the 2 hypotheses.
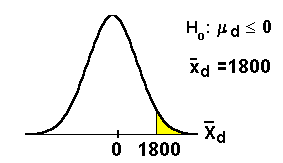
A person will earn a higher salary with a degree
if the average difference is greater than 0. This
is our alternate hypothesis.

right-tailed test
Determine the random variable and the
distribution for the test.

Student-t because it is a test of
matched or paired samples and there is no
population standard deviation.
Using the statistic calculated from the data,
calculate the p-value.

The calculator calculates the sample mean and the
sample standard deviation of the differences at
the same time it calculates the p-value.
sample mean for the differences = 1800
sample standard deviation for the differences =
1643 (to the nearest whole number).
Enter the data into list L1 and use TI-83 or
TI-84 calculator functions STAT TESTS 2:
T-Test.
Inpt: Data
μ0: 0
List: L1
Freq: 1
n1: 40
μ: > μ0
The p-value (p) is 0.0352.
Compare α and the p-value and make a
decision.
Assume α = 0.05
Since 0.05 > 0.0352 (α>
p-value), we reject Ho.
Write an appropriate conclusion.
We conclude that a person will earn a
higher starting salary for an environmental job
when he or she has earned a degree.
(Since we rejected the null hypothesis,
we conclude the alternate μd > 0
is true. Therefore, the average
difference is positive. This means that we
conclude that a person earns a higher salary
with a degree.)
Example
The
following problem is a hypothesis test
where the effectiveness of a course on improving
math comprehension is done. Students are
testing before the class and after the class to
see if taking the course improved their math
comprehension. Close the window when you are
finished viewing the example. You will return
here.
Think About It
Now that you have studied hypothesis tests for
means and proportions, do the Try-It examples in Introductory
Statistics.
This is the last section of this lesson.
Up » 10.1
Hypothesis Testing for Two Population Means
»
10.2 Hypothesis Testing for Two Population
Proportions » 10.3 Hypothesis Testing
for Matched or Paired Samples
|