Lesson 10.2 Hypothesis Testing for Two
Population Proportions
Hypothesis Testing for Two Population
Proportions, Independent Groups
The distribution for a hypothesis test of two
population proportions is the normal.
The statistic is the difference between the
estimated proportions of the two groups calculated
from the data. If we call the groups group 1 and
group 2, then the random variable is:
P1' - P2'
and the statistic is:
p1' - p2'
where
p1'
is the estimated proportion of the
sample taken from group 1 and
p2'
is the estimated proportion of the sample taken
from group 2.
Remember that an estimated proportion p'
is the number of successes (x) divided by
the sample size (n).
The two independent groups are populations that
are normally distributed.
When the null hypothesis is that there is no
difference between the population group means, we
write Ho as:
p1 - p2 = 0
Depending on the test, Ho may also be
written as:
p1 - p2
= 0
Depending on the test, Ho may also be
written as

or

If Ho is p1 - p2
= 0, then we are testing p1
= p2.
For the other cases, we could write:

and

Hypothesis Testing Problems
Using TI-83 or TI-84 calculators
Example: A local youth soccer league wanted to make
a comparison between the proportion of winning games
for the girls and boys under 12 select soccer teams.
The league randomly chose the 1999 season.
The under 12 boys select soccer team won 38 of 44
games. The under 12 girls select soccer team won
36 of 42 league games. Is the proportion of games
won by the under 12 girls select team less than
the proportion of games won by the under 12 boys
select soccer for any given year? Conduct
an appropriate hypothesis test using a level of
significance of 0.01.
The important numbers are:
- for the girls: successes x
= 36; n = 42
- for the boys: successes x =
38; n = 44
- α = 0.01
Formulate the 2 hypotheses.
Let the girls be group 1 and
the boys be group 2.
Ho: p1 = p2
Ha: p1 <
p2
left-tailed test
Determine the random variable and the
distribution for the test.
P1' - P2'
Normal
Using the statistic calculated from the data,
calculate the p-value.
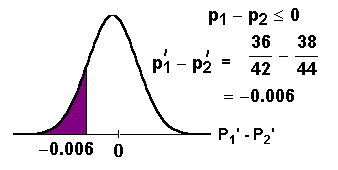
Use TI-83 or TI-84 calculator functions.
STAT TESTS 6: 2-PropZTest.
n1: 42
x2: 38
n2: 44
p1: < p2
Calculate
The p-value (p) is 0.4654.
Compare α and the p-value and make a decision.
α = 0.01
Since 0.01 < 0.4654 (α< p-value), we do
not reject H0.
Write an appropriate conclusion.
We conclude that the proportion of games won by
the under 12 girls select team is the
same as the proportion of games won
by the under 12 boys select soccer team for any
given year
Example
The
following problem is a hypothesis test
that compares two groups of voters (two
population proportions). This example shows you
the TI-83 keypad and the keystrokes. Close the
window when you are finished viewing the
example. You will return here.
Please continue to the next section of this
lesson.
Up » 10.1
Hypothesis Testing for Two Population Means
»
10.2 Hypothesis Testing for Two Population
Proportions » 10.3 Hypothesis Testing for
Matched or Paired Samples
|