|

Lesson 9.1 Hypothesis Tests in General
Hypothesis Testing
Hypothesis tests, like CIs, are a part of
inferential statistics, the science of drawing
statistical conclusions from specific data. A
hypothesis test, called a test of significance,
attempts to answer the question, "Could the data
have occurred purely by chance?"
Hypothesis testing is done constantly in
medicine, business, education, polling,
government, and the hard and soft sciences. To do
a hypothesis test, set up two contradictory
statements which are the hypotheses. The first
hypothesis is often the accepted belief or is
assumed to be true. Then conduct the test to
determine if the data supports or does not support
the first hypothesis.
There are basic steps to a hypothesis test:
Step 1: Formulate the 2
hypotheses. They are called the null hypothesis
and the alternate hypothesis.
- Ho is the first
hypothesis and is called the null hypothesis.
- Ha is the second
hypothesis and is called the alternate
hypothesis. It is contradictory to the null
hypothesis.
Step 2: Determine the random
variable and the distribution for the test.
Knowing the random variable and the distribution
for the test, calculate a statistic from the data
(for example, the sample mean or the estimated
proportion) that will assess the evidence against
the null hypothesis.
Step 3: Using the statistic,
calculate the p-value. The p-value is the
probability that the statistic calculated from the
data will happen purely by chance when the null
hypothesis is true. A smaller p-value indicates
stronger evidence against Ho.
Step 4: Make a comparison of the
p-value with a fixed or pre-conceived significance
level, α. α acts as a cut-off point below which we
agree that the statistic calculated from the data
is statistically significant.
Then make a decision:
- If α> p-value, then we
reject the null hypothesis.
- If α< p-value, then we
do not reject the null hypothesis.
- If α = p-value, then our
test is inconclusive. We, most likely, would
gather more data and run at least one more test.
Step 5: Write an appropriate conclusion to the
hypothesis test so that everyone can understand
the result.
If we reject the null hypothesis, we write the
alternate hypothesis in a sentence as the
conclusion.
If we do not reject the null hypothesis, we
simply write it in a sentence as the conclusion.
The Null and Alternate
Hypotheses and P-value
The null hypothesis, Ho, if written as
a mathematical statement, has one of the following
symbols in it:

(equal symbol, less than or equal
symbol, greater than or equal symbol)
The alternate hypothesis, Ha, if
written as a mathematical statement, has one of
the following symbols in it:

(not equal symbol, less than
symbol, greater than symbol)
Remember, Ho and Ha are
contradictory.
The following examples demonstrate either a test
of a single population mean, μ, or a test of a
single population proportion, p. A test is either
left-tailed, right-tailed, or two-tailed. The
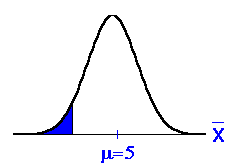
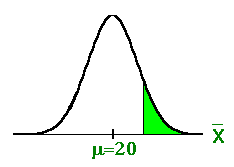
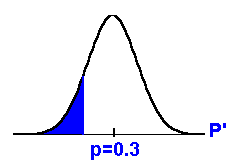
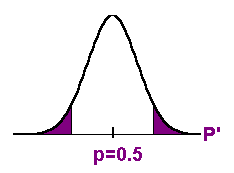
shaded area in the graphs show the p-value.
Example:
Ho: μ = 5
Ha: μ < 5
Left-tailed test. The
"<"
in Ha tells us this fact.

Example:

Right-tailed test. The
">"
in Ha tells us this fact.

Example:

Left-tailed test.
The "<"
in Ha tells us this fact.

Example:

Two-tailed test. The
" " "
in Ha tells us this fact.

Notice that the p-value is divided equally in
both tails.
NOTE: We use
technology (TI-83 or TI-84 calculators) to
calculate the p-value for hypothesis tests in
the next three sections of this Lesson. For this
Lesson, we do hypothesis testing for a single
population mean or a single population
proportion.
Pre-conceived Level of
Signigicance, α
Fixed α is also known as a pre-conceived α. It is
the probability to which we compare the p-value. A
fixed α level of 0.05 or 0.01 is most commonly
used. These levels were chosen before we had
computers and had to use limited tables. Still,
today, we often use 0.05 or 0.01. However, many
hypothesis testers choose other values. For
example, a medical hypothesis test might have an α
of 0.001. A hypothesis test that was concerned
with racial bias in jury selection in the years
between 1960 and 1980 used an α equivalent to the
probability of getting 3 consecutive royal flushes
in poker! (This probability is almost 0.)

For this class, if α is not given,
we will use 0.05.
Think About It
Do the Try-It examples in Introductory
Statistics. You can check some of the
answers in the back of the book. Trying the
examples will help you understand how to set up
hypothesis.
Please continue to the next section
of this lesson.
Up » 9.1 Hypothesis Testing »
9.2 Hypothesis Testing - Known »
9.3 Hypothesis Testing- Unknown »
9.4 Hypothesis Testing for a Single Population
Proportion » 9.5 Type I and II Errors
Lesson 1
| Lesson 2 | Lesson 3 | Lesson 4 | Lesson 5 | Lesson 6 | Lesson 7 | Lesson 8 | Lesson 9 | Lesson 10 | Lesson 11 | Lesson 12
|