|

Lesson 9.2 Hypothesis Test for a Population
Mean – Known Population Standard Deviation
Hypothesis Testing for a
Population Mean When the Population Standard
Deviation is Known
When the population standard deviation is known,
the distribution for a hypothesis test of a single
population mean is the normal (see Lesson 7, The
Central Limit Theorem).
The statistic is the sample mean calculated from
the data. We use it together with the known
population standard deviation to calculate the
p-value.
Hypothesis Testing Problems
Using TI-83 or TI-84 calculators
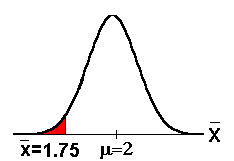
Example: It is believed that today's teenagers
use instant messaging on the internet an average
of 2 hours per day with a known standard deviation
of 1/2 hour. A group of teachers thought that the
average time spent was less than 2 hours per day.
They randomly surveyed 100 teenagers and
calculated an average amount of time of 1.75
hours. Conduct an appropriate hypothesis test to
determine if the average amount of time teenagers
spend using instant messaging is less than 2 hours
per day. Use a fixed or pre-conceived α of 0.01.
The important numbers are the:
- belief that the population
mean is 2 hours,
- known population standard
deviation of 1/2 hour,
- sample size of 100
teenagers,
- the sample mean of 1.75
hours calculated from the data,
- α = 0.01
Formulate the 2 hypotheses.
The first sentence tells us the null hypothesis.
The sentence, "Conduct an appropriate hypothesis
test to determine if the average amount of time
teenagers spend using instant messaging is less
than 2 hours per day", tells us the alternate
hypothesis and that the test is left-tailed.
Ho: μ = 2
Ha: μ< 2
Determine the random variable and the
distribution for the test.

normal for averages because the population
standard deviation is known.
Using the statistic calculated from the data,
calculate the p-value.

Use TI-83 or TI-84 calculators
functions.
-
STAT TESTS 1:Z-Test
-
Inpt: Stats
-
μo: 2
-
σ: .5
-
xbar: 1.75
-
n:100
-
μ: < μo
-
Calculate
The p-value (p) is 0.000000287
which is almost 0. (E -7 is equal to 10-7
= 0.0000001. The number 2.87105E-7 is
approximately 2.87 multiplied by 0.0000001 =
0.000000287.)
Compare α and the p-value and make
a decision.
Since α = 0.01 and 0.01 >
0.000000287 (α> p-value), we reject Ho.
Write an appropriate conclusion.
We conclude that the average
amount of time that teenagers spend using
instant messaging per day is less than 2 hours.
Example
Candy companies and students
perform hypothesis on testing on the average
number of pieces of candy in a bag! The following
example is a hypothesis test about the
average number of jelly beans in a small bag of
candy. Close the window when you are
finished viewing the example. You will return
here.
Think About It
Do the Try-It examples in Introductory
Statistics. Verify the numbers in the
problem using your calculator. The calculator
instructions follow the problem.
Please continue to the next section
of this lesson.
Up » 9.1
Hypothesis Testing
» 9.2 Hypothesis
Testing - Known » 9.3 Hypothesis Testing-
Unknown » 9.4 Hypothesis Testing for a
Single Population Proportion »
9.5 Type I and II Errors
|