|

Lesson 9.4 Hypothesis Testing for a Population
Proportion
Hypothesis Testing for a
Population Mean When the Population Standard
Deviation is Unknown
The distribution for a hypothesis test of a
single population proportion is the normal for
estimated proportions (see Lesson 7, The Central
Limit Theorem).
The statistic is the estimated proportion
calculated from the data. We use it to calculate
the p-value.
Hypothesis Testing Problems
Using TI-83 or TI-84 calculators
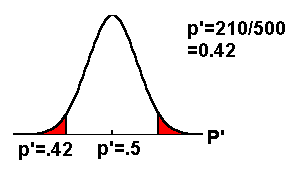
Example: If we flip a fair coin, we believe that
heads comes up 50% of the time. Four students, for
their math project, flipped one fair coin 500
times and recorded 210 heads. Is the coin fair?
Conduct an appropriate hypothesis test. Use a
level of significance of 0.005.
The important numbers are the:
- belief that heads comes up
50% of the time
- 210 heads
- sample size of 500 flips
of the coin
- level of significance
0.005
Formulate the 2 hypotheses.
The first sentence and the question, "Is the coin
fair?" give us the information we need. If the
coin is fair, then the proportion of times heads
comes up is 0.5 and if the coin is not fair, the
proportion of times is not equal to 0.5. The test
is two-tailed.

Determine the random variable and the
distribution for the test.
P'
normal for estimated proportions
Using the statistic calculated from the data,
calculate the p-value.

Use TI-83 or TI-84 calculator
functions.
-
STAT TESTS 5:1-PropZtest
-
po:
.5
-
x: 210
-
n: 500
-
p: =/= po
-
Calculate
The p-value (p) is 3.466967E- 4
which is approximately 0.0003 (E-4 = 10-4
= .0001 and 3.466967E-4 is approximately 3
multiplied by .0001 = 0.0003).
Compare α and the p-value and make
a decision.
Assume α = 0.05 since none is
given.
Since α = 0.005 and 0.005 > 0.0003 (α>
p-value), we reject Ho.
Write an appropriate conclusion.
We conclude that the coin is not
fair.
Example
Most of us believe that 50% of
births are girls and 50% are boys. The following
problem hypothesizes that 50% of first
born children are girls. Close the window when
you are finished viewing the example. You will
return here.
Please continue to the next
section of this lesson.
Up » 9.1
Hypothesis Testing
» 9.2 Hypothesis Testing -
Known » 9.3 Hypothesis Testing-
Unknown » 9.4 Hypothesis Testing
for a Single Population Proportion »
9.5 Type I and II Errors
|