|

12.1 Linear Equations
Bivariate Data
Up to this point, you have used single-valued or univariate data. This lesson introduces bivariate data which are two related values of data. Examples include:
- height and weight
Example: (72 inches, 200 pounds)
- the year a person was born and life expectancy
Example: (1950, 65 years)
- your grade on a second math exam and your final exam grade
Example: (80%, 83%)
- education and income
Example: (4 years of college, $100,000)
You will learn the basics of how to determine if there is a linear relationship between the two values of the bivariate data by understanding the concepts of linear regression and correlation.
Notation
Linear regression for two variables is based on a linear equation of the form.
y = a + bx
where
x is the independent variable,
y is the dependent variable,
and a and b are constant numbers.
Typically, you choose a value for the independent variable x and solve the equation for y.
The graph of a linear equation of this form is a line that is not vertical.
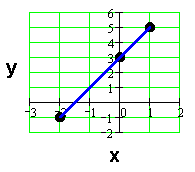
Example: y = 3 + 2x
By substitution:
If x = 1, then y = 5.
If x = 0, then y = 3.
If x = -2, then y = -1.
We can plot the points (1, 5), (0, 3), and (-2, -1) and construct a graph as shown below.

Back to Top
The Slope and Y-Intercept
For the linear equation:
y = a + bx
a = the y-intercept and
b = the slope of the line
- The slope b describes the steepness of the line (remember the rise/run formula).
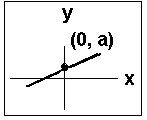
- The y-intercept a is the y coordinate of the point (0, a) where the line crosses the y-axis.
Examples:


Please continue to the next section of this lesson.
Up » 12.1 Linear Equations » 12.2 Scatter Plots » 12.3 The Regression Equation » 12.4 The Correlation Coefficient » 12.5 Prediction » 12.6 Outliers » 12.7 TI-83
|