|

Lesson 12.5 Prediction
Prediction
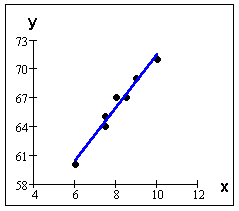
Under certain conditions, you can use the line of best fit for estimating y when you know x. The conditions are:
- the scatter plot looks linear,
- the correlation coefficient r tells us that the relationship between x and y is significant, and
- x and y are related in a way that it is reasonable for y to be dependent upon x (for example, generally tall people weigh more than small people).
The process of estimating y when you know x is called prediction.
Example: A study is done to examine if women wearing larger size shoes tend to be taller. Let x = a woman's shoe size and y = her height, in inches.
Woman's Shoe Size (x) |
7 1/2
|
8 1/2 |
9 |
6 |
8 |
7 1/2 |
10
|
Height, in inches (y) |
64
|
67 |
69 |
60 |
67 |
65 |
71
|

The equation of the line of best fit is :


is the woman's estimated height .
Let's predict a woman's height when her shoe size is 6 1/2. Let x = 6.5 and substitute the x value in the equation.

So, when a woman's show size is 6 1/2, her predicted height is about 61.8 inches.
Caution
Do not use the regression equation to predict values outside the domain of x.
For the shoe size and height example above, x = 11 and x = 4 are outside the domain of x, so do not try to use the regression equation to predict the heights.
Think About It
For the woman's shoe size and height example, predict the heights given the following shoe sizes. The equation is:

• shoe size = 9 1/2.
• shoe size = 8 1/2. Why is the predicted y different from the actual y?
• shoe size = 11 1/2. (Caution!)
NOTE: We use technology (TI-83 or TI-84 calculators) to perform the calculations for linear regression and then we use the regression equation to make predictions.
Please continue to the next section of this lesson.
Up » 12.1 Linear Equations » 12.2 Scatter Plots » 12.3 The Regression Equation » 12.4 The Correlation Coefficient » 12.5 Prediction » 12.6 Outliers » 12.7 TI-83
|