|

Lesson 12.4 Correlation Coefficient
If a scatter plot shows a possible linear relationship, then the correlation coefficient indicates how strong the relationship is between x and y. We use the letter r for the correlation coefficient.

If r = 1 or r = -1, there is "perfect correlation." This means that the points are already in a straight line. In the real world, perfect correlation is very unlikely to happen.
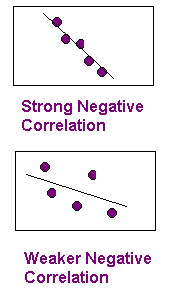
The closer r is to 1 or -1, the better the correlation between x and y because the data points are closer to the line of best fit.

Facts About the Correlation Coefficient
- There is positive correlation if x increases then y increases or if x decreases then y decreases. If there is positive correlation, then the line has a positive slope.
- There is negative correlation if x increases then y decreases or if x decreases then y increases. If there is negative correlation, then the line has a negative slope.
- There is no correlation if the correlation coefficient is 0 (r = 0). This means there is no relationship between x and y. If there is no correlation, then the slope of the line is 0.
- High correlation does not necessarily mean that x causes y or y causes x.
Significance
The 95% Critical Values of the Sample Correlation Coefficient Table can be used to help you decide if the correlation coefficient r is significant or not. If r is significant, then the line may be used for prediction. In order to use the table:
- In the left column, look up the degrees of freedom n - 2 where n is the number of data points.
- In the right column, look up the corresponding critical value. Use the critical value with the same sign as r.
- Compare the critical value and r.
- Positive r and positive critical value: If r > the critical value, then the relationship between x and y is significant.
- Negative r and negative critical value: If r < the critical value, then the relationship between x and y is significant.
- Otherwise, the relationship between x and y is not significant.
Close the window when you are finished with the chart.
Example: Suppose r = 0.612 and there are 17 data points. If you look up degrees of freedom n - 2 = 15, the critical value is + 0.482. Since 0.612 > 0.482, the relationship between x and y is significant.
Example: Suppose r = - 0.612 and there are 12 data points. If you look up degrees of freedom n - 2 = 10, the critical value is - 0.576. Since - 0.612 < - 0.576, the relationship between x and y is significant.
Example: Suppose is r = 0.213 and there are 6 data points. If you look up degrees of freedom n - 2 = 4, the critical value is + 0.811. Since r is between the negative and positive critical values, ( - 0.811 < r < 0.811), the relationship between x and y is NOT significant.
NOTE: The 95% Critical Values of the Sample Correlation Coefficient table is also in Collaborative Statistics: Text at the end of 12 before the Summary.
Think About It
Try the following example.
Suppose r = 0.555 and there are 23 data points. Is r significant?
The 95% Critical Values of the Sample Correlation Coefficient Table to determine if r is significant. Close the window when you are finished with the chart.
NOTE: We use technology (TI-83 or TI-84 calculators) to calculate the correlation coefficient. It is actually calculated during linear regression.
Please continue to the next section of this lesson.
Up » 12.1 Linear Equations » 12.2 Scatter Plots » 12.3 The Regression Equation » 12.4 The Correlation Coefficient » 12.5 Prediction » 12.6 Outliers » 12.7 TI-83
|