|

Lesson 12.3 The Regression Equation
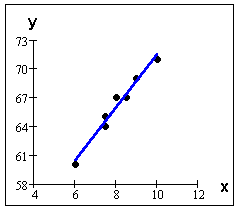
If a scatter plot indicates that there is a linear relationship between the independent and dependent variables, then the next step is to fit a line to the data. There is one line which gives the best fit and is called the "line of best fit" or the "least squares line." The equation for the line is actually determined using calculus. The process to determine the line of best fit is called Linear Regression. The bivariate data is shown in a scatter plot and line of best fit for the following data. The line of best fit was calculated using linear regression.
Woman's Shoe Size (x) |
7 1/2
|
8 1/2
|
9
|
6
|
8
|
7 1/2
|
10
|
Height, in inches (y) |
64
|
67
|
69
|
60
|
67
|
65
|
71
|

The regression equation has the format:

For the example above, the equation is:

The variable

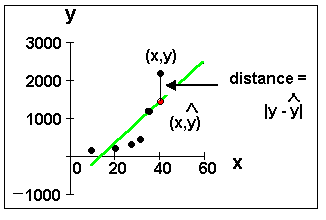
(read as "y-hat") is the y coordinate of the point on the line. It is the estimated or predicted y value. Data points have the format:

and points on the line of best fit have the format:

Sum of Squared Errors (SSE)
To calculate the line of best fit, calculus is actually used to minimize the sum of squared errors (SSE). We will use technology (TI-83) for this process.

To calculate the SSE, find the distance between each y value from the data and the estimated or predicted y value, square each distance, and add them together.
SSE = 
The SSE is a special measure of how much the estimated or predicted y values on the line differ from the actual y values.
Comments
- The line of best fit estimates the average value for y given a value for x. The average value for y is the best estimator.
- The line of best fit always passes through the point

- Remember, data rarely fit a line exactly.
Think About It
Using the data in the table below, plot a line of best fit "by eye."
|
x
|
1
|
2
|
3
|
4
|
5
|
6
|
|
y
|
3
|
5
|
4
|
5
|
7
|
8
|
Use a ruler to scale the axis, carefully plot the points, and then draw what you consider to be the line of best fit. Then, write the equation of the line in the form.

To get a, look at the point where the line crosses the y-axis. To get b, use the rise/run formula for slope. Do you think that other students would have the same exact line as you do?
NOTE: We use technology (TI-83 or TI-84 calculators) to perform the calculations for linear regression.
Please continue to the next section of this lesson.
Up » 12.1 Linear Equations » 12.2 Scatter Plots » 12.3 The Regression Equation » 12.4 The Correlation Coefficient » 12.5 Prediction » 12.6 Outliers » 12.7 TI-83
|