|

Lesson 12.6 Outliers
Outliers, in General
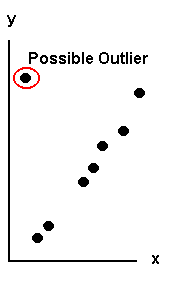
Outliers are points far from the line of best
fit. The difference between the actual y and the
estimated y for an outlier is "large." Outliers
should be examined closely. In some cases, they
should be deleted from the set of data points. In
other cases, they should not be deleted at all
because they are the key to the population under
study. You must carefully examine what causes a
data point to be an outlier.

In this course, you will learn one
method for determining outliers. When you take
higher level courses in Linear Regression,
you will learn other methods for determining
outliers.
Outlier Calculation
To calculate outliers:
- Do linear regression.
- Calculate each (actual y - estimated y) value:
Each

These values are called residuals.
- Calculate the SSE which is the sum of the
squares of all the (actual y - estimated y)
values. SSE =

- Calculates, the standard deviation of all the

values (the residuals):

where n - 2 is equal to the number of data
points - 2 .
- Multiply 1.9 by s.
- Compare the absolute value of each residual to
1.9s.
- If the absolute value of any residual is
greater than or equal to 1.9s, the corresponding
point is an outlier. (If

then the corresponding point is an outlier.)
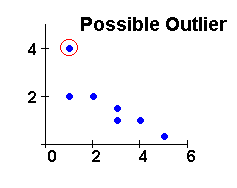
Example: Linear regression produces the following
line of best fit:

The data points are
(1, 2), (3, 1.5), (4, 1), (2, 2), (3, 1), (5,
0.3), (1, 4).

The table contains the actual y
values, the estimated y values
calculated from the line of best fit, and the absolute
value of the difference.
|
y
|
2
|
1.5 |
1 |
2 |
1 |
0.3 |
4
|

|
2.84
|
1.49 |
0.82 |
2.17 |
1.49 |
0.15 |
2.84
|
|

|
0.84
|
0.01 |
0.18 |
0.17 |
0.49 |
0.15 |
1.16
|
SSE = .842 +.012 +.182
+ .172 +.492 +.152 +1.162
= 2.38
n = 7 data points


Compare each value in the table below to 1.31.
|

|
0.84
0.01
0.18
0.17
0.49
0.15
|
1.16
|
No value is greater than or equal to 1.31. We do
not have any

Therefore, no point is an outlier.
Think About It
Try problem number 87 in Chapter 12 of Introductory
Statistics.
Please continue to the next section
of this lesson.
Up » 12.1 Linear Equations
»
12.2 Scatter Plots »
12.3 The Regression Equation »
12.4 The Correlation Coefficient »
12.5 Prediction » 12.6 Outliers »
12.7 TI-83
|